Monitoring the IBM DB2 Server in a DPF Environment
The Database Partitioning Feature (DPF) is available on DB2 UDB Enterprise Server Edition (ESE). With DPF your database is scalable as you can add new machines and spread your database across them. This means more CPUs, more memory and more disks from each of the additional machines for your database! DB2 UDB ESE with DPF is ideal to manage data warehousing, data mining and online analytical processing (OLAP) workloads. It can also work well with online transaction processing (OLTP) workloads.
When a database is partitioned, you split your database into different independent parts, each consisting of its own data, configuration files, indexes and transaction logs. Each of these parts is a database partition. You can assign multiple partitions to a single physical machine. These are called ‘logical partitions’ and they share the resources of the machine.
A single-partition database is a database with only one partition.
A multi-partition database (also referred to as a partitioned database), is a database with two or more partitions. Depending on your hardware environment, there can be several configurations in which you can partition your database. Figure 1 shows the configuration of one logical partition in a single SMP machine.
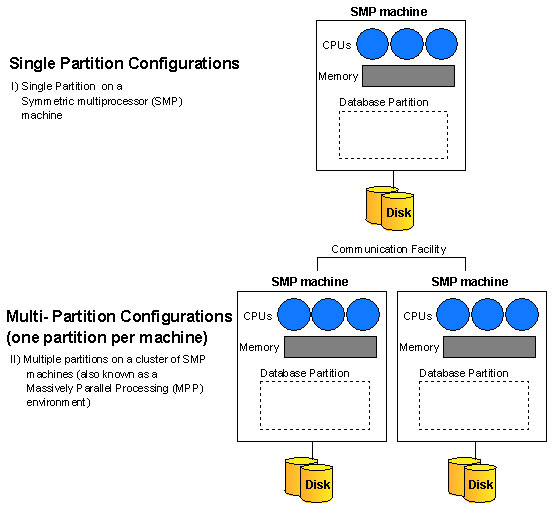
Figure 1 : A Single-partition Configuration
Figure 2 shows more multi-partition configurations with several logical partitions in a machine.
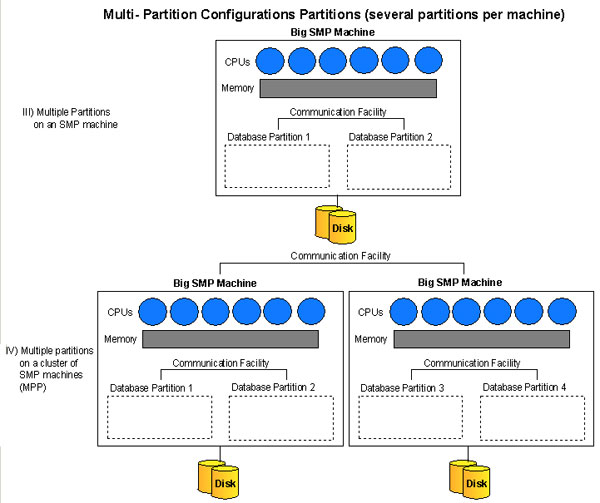
Figure 2 : A multi-partition config
A user will connect to the database and issue queries as usual without a need to know that the database has been partitioned.
Figure 3 visualizes how a DB2 environment is split in a DPF system.
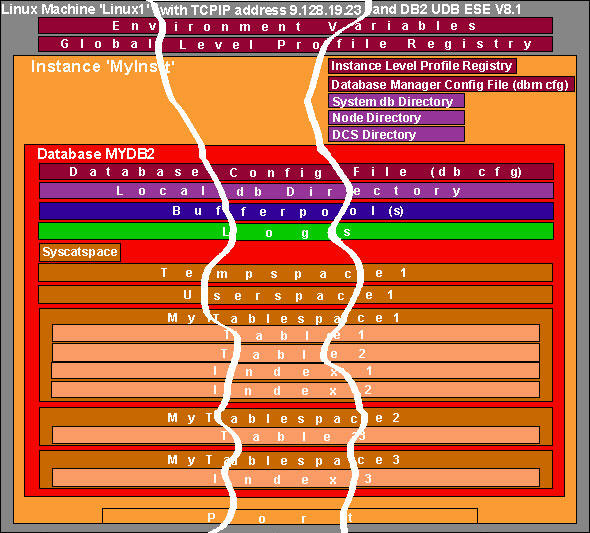
Figure 3 : A visualization of a DPF system
eG Enterprise provides an exclusive DB2 DPF monitoring model that monitors the load on the DB2 server, and reveals whether the load is uniformly distributed across all the logical partitions.
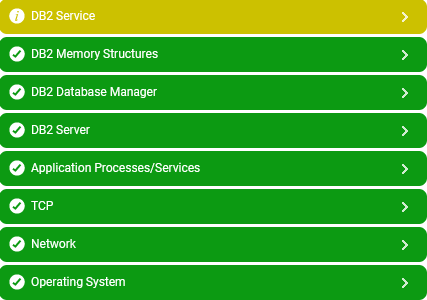
Figure 4 : The DB2 DPF Monitoring Model
Each layer of this model is mapped to a variety of tests that report useful statistics that provide accurate answers to persistent performance queries:
- What is the current connection load on the DB2 database manager? How many of these connections are local, and how many are remote connections?
- How quickly does the DB2 server process requests from client applications? Are there sufficient agents in the agent pool to service all the client requests?
- Are the agents in the pool utilized optimally, or are too many agents idle?
- Does the database server perform sorting efficiently? Has adequate sort heap space been allocated to the database manager to enable this?
- Are sort overflows kept at a minimum?
- Does sorting take too long?
- Are lock escalations occurring too frequently on the logical partitions?
- Do applications obtain locks quickly, or do they have to wait too long for locks?
- Are the database buffer pools adequately sized for each logical partition?
- Are the page cleaners and prefetchers been utilized effectively by each logical partition?
- Are too many rollbacks happening on the logical partitions?
- Have too many SQL statements failed on any logical partition? If so, which one is it?
The sections to come elaborate on each layer of Figure 1, the tests associated with them, and the statistics they extract.