Clariion Disks Test
This test reveals the state, I/O activity, and overall health of each disk supported by the storage system.
Target of the test : An EMC CLARiiON storage device
Agent deploying the test : A remote agent
Outputs of the test : One set of results for each disk within each disk supported by the storage device.
| Parameter | Description |
|---|---|
|
Test Period |
How often should the test be executed. |
|
Host |
The IP address of the storage device for which this test is to be configured. |
|
Port |
The port number at which the storage device listens. The default is NULL. |
|
CLARiiON IP |
By default, the host IP will be displayed here. If the eG agent has also been configured to use the SMI-S provider for metrics collection, then the IP address of host on which the SMI-S provider has been installed, will be displayed here by default. In this case, you should change the value of this parameter to reflect the IP address of the EMC CLARiiON storage device. However, if the eG agent uses only the NaviSphere CLI for monitoring, then the default settings can remain. |
|
NaviseccliPath |
The eG agent uses the command-line utility, NaviSecCli.exe, which is part of the NaviSphere Management Suite, to communicate with and monitor the storage device. To enable the eG agent to invoke the CLI, configure the full path to the CLI in the NaviseccliPath text box. |
|
User Name and Password |
Provide the credentials of a user who is authorized to access the storage device in the User Name and Password text boxes. |
|
Confirm Password |
Confirm the password by retyping it here. |
|
Ignore Disabled Disks |
By default, this flag is set to No, indicating that the test monitors all disks by default. Set this flag to Yes if you want the test to consider only the 'enabled' disks for monitoring. |
|
Exclude Disks |
Provide a comma-separated list of disk IDs that you want to exclude from the monitoring scope of this test. By default, this is set to none indicating that no disks are excluded by default. |
|
Timeout |
Indicate the duration (in seconds) for which this test should wait for a response from the storage device. By default, this is set to 120 seconds. Note that the 'Timeout' value should always be set between 3 and 600 seconds only. |
|
DD Frequency |
Refers to the frequency with which detailed diagnosis measures are to be generated for this test. The default is 1:1. This indicates that, by default, detailed measures will be generated every time this test runs, and also every time the test detects a problem. You can modify this frequency, if you so desire. Also, if you intend to disable the detailed diagnosis capability for this test, you can do so by specifying none against DD frequency. |
|
Detailed Diagnosis |
To make diagnosis more efficient and accurate, the eG Enterprise embeds an optional detailed diagnostic capability. With this capability, the eG agents can be configured to run detailed, more elaborate tests as and when specific problems are detected. To enable the detailed diagnosis capability of this test for a particular server, choose the On option. To disable the capability, click on the Off option. The option to selectively enable/disable the detailed diagnosis capability will be available only if the following conditions are fulfilled:
|
| Measurement | Description | Measurement Unit | Interpretation | ||||||||||||||||||||||||||||||||||||||||||
|---|---|---|---|---|---|---|---|---|---|---|---|---|---|---|---|---|---|---|---|---|---|---|---|---|---|---|---|---|---|---|---|---|---|---|---|---|---|---|---|---|---|---|---|---|---|
|
State |
Indicates the current state of this disk. |
|
The states this measure reports and the numeric values that correspond to each of the states are as follows:
Note: By default, this measure reports the States listed in the table above to indicate the state of a disk. The graph of this measure however, represents disk state using the numeric equivalents - 0 to 19. |
||||||||||||||||||||||||||||||||||||||||||
|
LUNs |
Indicates the number of LUNs that are sharing this disk. |
Number |
Use the detailed diagnosis of this measure to know which LUNs are sharing this disk. |
||||||||||||||||||||||||||||||||||||||||||
|
Busy ticks |
Indicates the percent utilization of this disk. |
Percent |
The values in percent and their respective states are listed below:
|
||||||||||||||||||||||||||||||||||||||||||
|
Hard read errors |
Indicates the number of hard read errors in this disk. |
Number |
The values and their respective states are listed below:
Increase in the value of this measure indicates that the disk life is going to end or fail. |
||||||||||||||||||||||||||||||||||||||||||
|
Hard write errors |
Indicates the number of hard write errors in this disk. |
Number |
The values and their respective states are listed below:
Increase in the value of this measure indicates disk life is going to end or fail. |
||||||||||||||||||||||||||||||||||||||||||
|
Soft read errors |
Indicates the number of uncorrected read errors in this disk. |
Number |
The values and their respective states are listed below:
Increase in value of this measure indicates disk life is going to end or fail. |
||||||||||||||||||||||||||||||||||||||||||
|
Soft write errors |
Indicates the number of uncorrected write errors in this disk. |
Number |
The values and their respective states are listed below:
Increase in value of this measure indicates disk life is going to end or fail. |
||||||||||||||||||||||||||||||||||||||||||
|
Read requests |
Indicates the number of read requests made per second to this disk. |
Reqs/Sec |
Compare the value of these measures across disks to isolate overloaded disks. This will also reveal irregularities in load balancing across disks. |
||||||||||||||||||||||||||||||||||||||||||
|
Write requests |
Indicates the number of write requests made per second to this disk. |
Reqs/Sec |
|||||||||||||||||||||||||||||||||||||||||||
|
Data reads |
Indicates the rate at which data is read from this disk. |
MB/Sec |
|
||||||||||||||||||||||||||||||||||||||||||
|
Data writes |
Indicates the rate at which data is written to this disk. |
MB/Sec |
|
||||||||||||||||||||||||||||||||||||||||||
|
Total bandwidth |
Indicates the sum of data reads and data writes to this disk. |
MB/Sec |
|
||||||||||||||||||||||||||||||||||||||||||
|
Total capacity |
Indicates the total size of this disk. |
GB |
|
||||||||||||||||||||||||||||||||||||||||||
|
User capacity |
Indicates the amount of space on this disk that is assigned to bound LUNs. |
GB |
|
||||||||||||||||||||||||||||||||||||||||||
|
Usage |
Indicates the percentage of space in this disk that is currently in use. |
Percent |
Ideally, the value of this measure should be low. A consistent increase in this value could indicate a gradual, but steady erosion of space in the disk. |
||||||||||||||||||||||||||||||||||||||||||
|
Read retries |
Indicates the number of times read requests to this disk were retried. |
Number |
A low value is desired for this measure. |
||||||||||||||||||||||||||||||||||||||||||
|
Write retries |
Indicates the number of times write requests to this disk were retried. |
Number |
A low value is desired for this measure. |
||||||||||||||||||||||||||||||||||||||||||
|
Remapped sectors |
Indicates the number of sectors on this disk that were remapped to new locations on the disk due to read/write errors. |
Number |
A low value is desired for this measure. |
||||||||||||||||||||||||||||||||||||||||||
|
Request service time |
Indicates the time taken by this disk to service requests. |
Secs |
A high value is typically indicative of a request processing bottleneck in the disk. Compare the value of this measure across disks to know which disks are experiencing significant latencies. |
The detailed diagnosis of the LUNs measure, if enabled, reveals the the IDs of the LUNs that are sharing a particular disk, and the Raid type of each LUN.
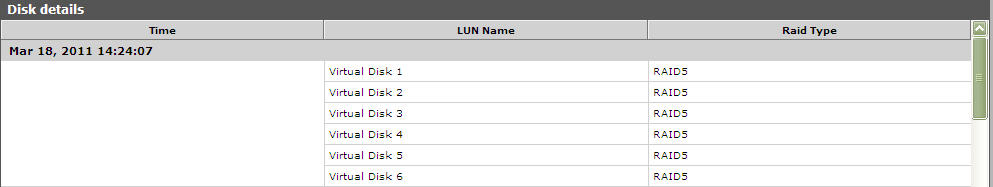
Figure 1 : The detailed diagnosis of the LUNs measure