Enabling Performance Logging on the Storage System
To achieve this, login to the host on which the Navisphere CLI operates, and issue the following command at the command prompt:
naviseccli -h <array-ip> -scope 0 -user <name of user with access to storage system> -password <password of user with access to storage system> setstats -on
For instance, if the IP address of the storage array is 192.168.10.86, and the credentials of the user with rights to access the storage array are username: john and password: john, the command will be:
naviseccli -h 19.168.10.86 -scope 0 -user john -password john setstats -on
Alternatively, you can follow the steps detailed below to enable performance logging on the storage system:
- From a web browser, connect to the storage array using the URL: http://<IP_address_of_storage_array>/
-
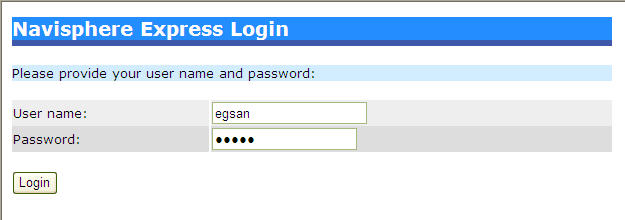
Figure 1 will then appear prompting you to login to the Navisphere Express Console. Provide the credentials of the SAN administrator against User name and Password, and click the Login button to login.
-
The Navisphere Express Console will then appear, as depicted by Figure 2.
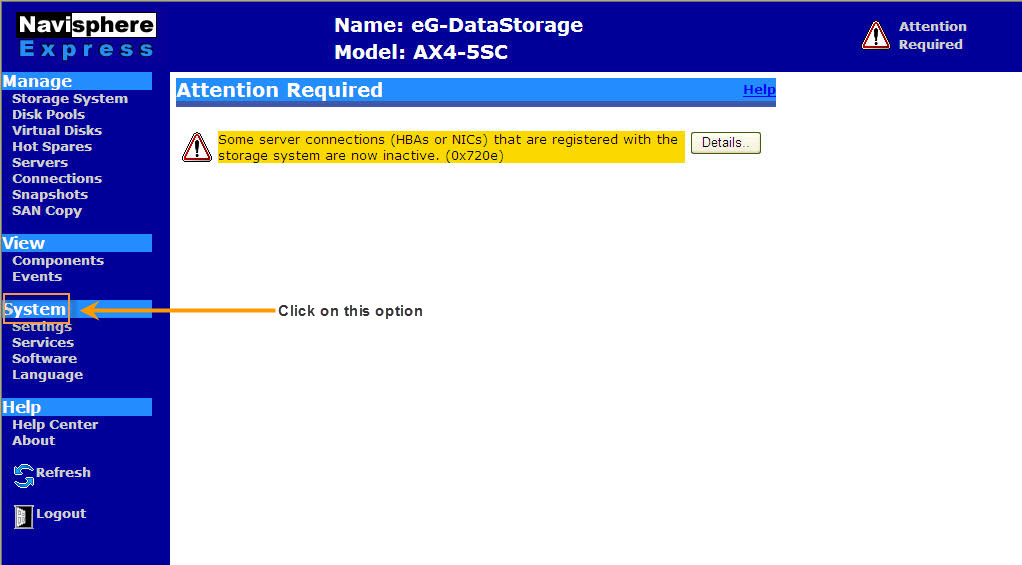
- From the list of options provided in the left panel of Figure 2, select the Services option under the System head (as indicated by Figure 2).
-
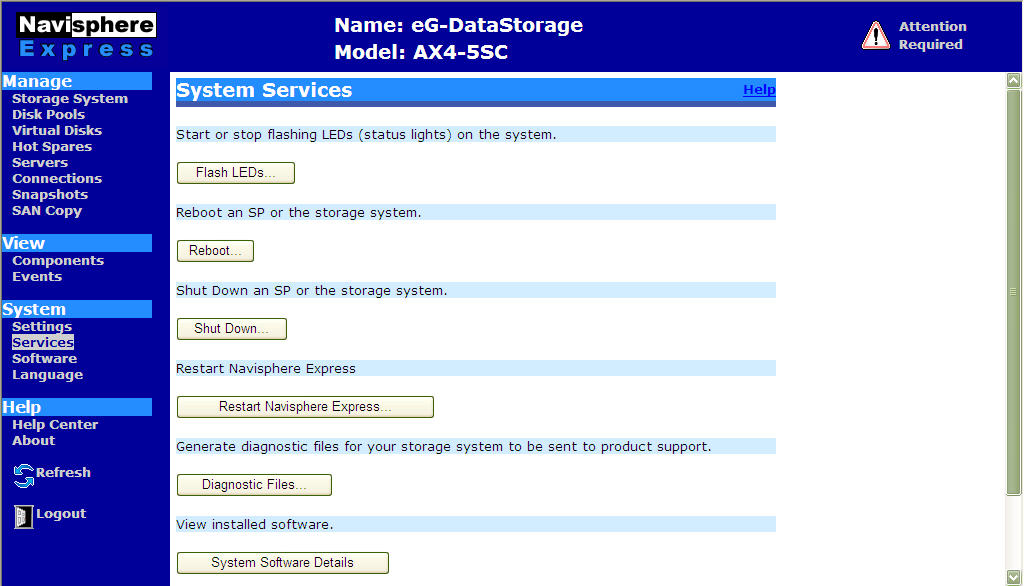
A System Services page will then appear in the right panel (see Figure 3). Click on the Diagnostic Files button in Figure 3.
-
When the Diagnostic Files page appears (see Figure 4), scroll down the page to view the Performance Logs button (see Figure 5). Click on this button.
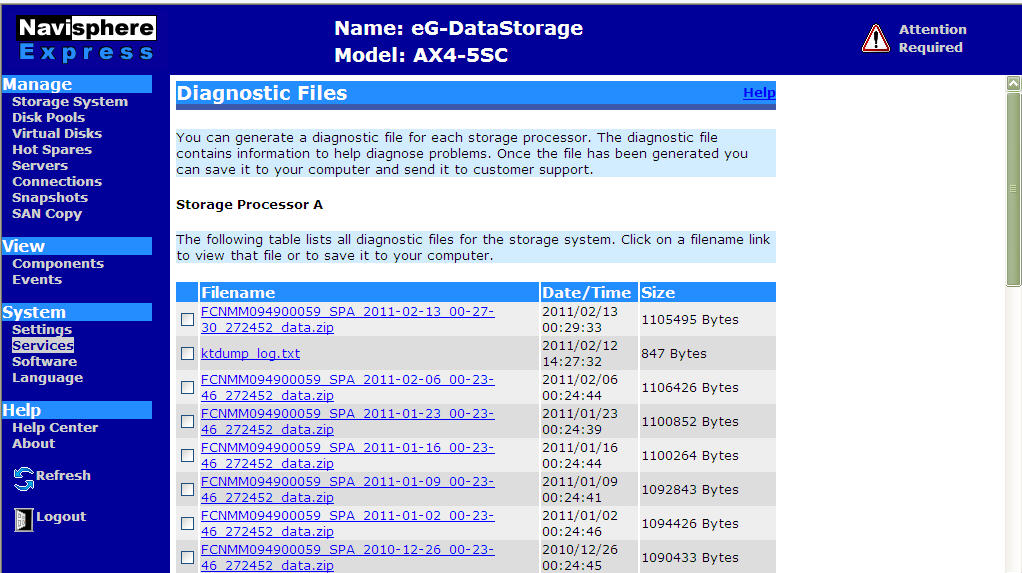
Figure 4 : The Diagnostic Files page
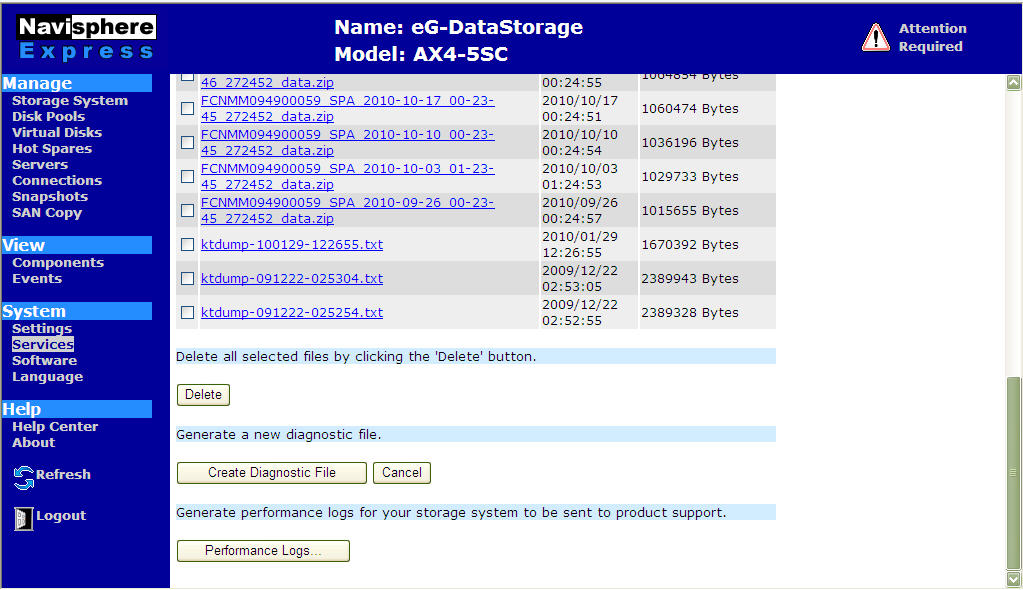
Figure 5 : Scrolling down the Diagnostic Files pages to view the Performance Logs button
-
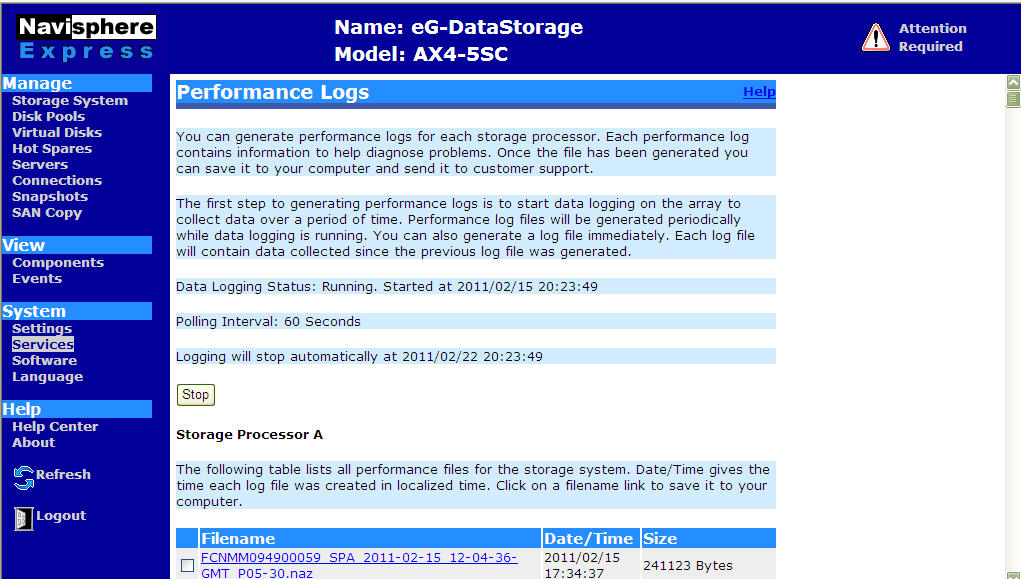
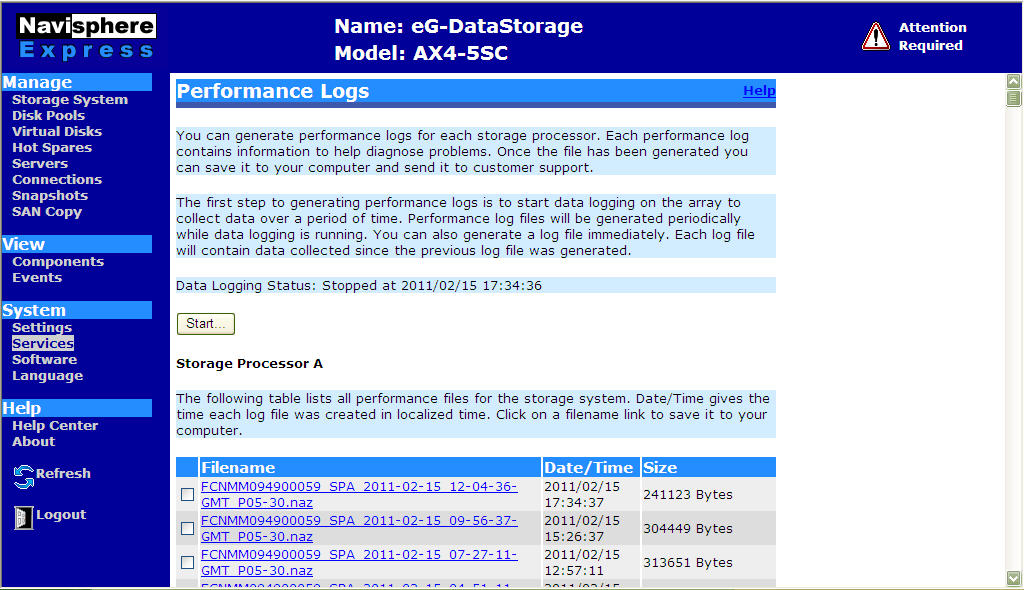
In the Performance Logs page that then appears (see Figure 6), click on the Start button to begin data logging.
-
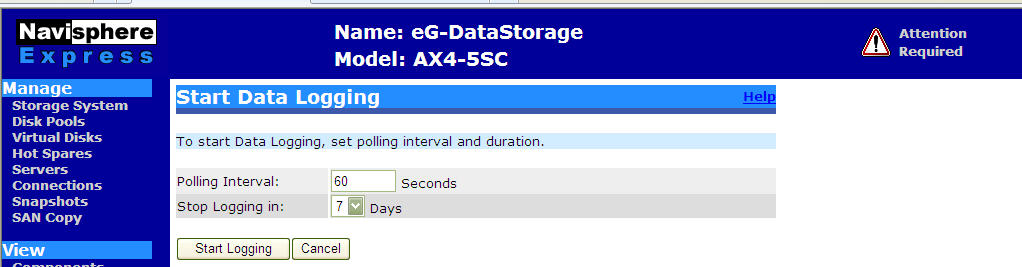
You can configure how frequently data logging should occur and also indicate when it should stop using the Polling interval and Stop Logging in controls (respectively) in Figure 7 that appears. Then, click the Start Logging button in Figure 7 to begin data logging.
-
Figure 8 then appears where you can review your data logging specifications.