PAN Domains Test
A Domain is a physical hardware platform that resides in a Processing Area Network. Once the domain is added to the PAN, the PAN Manager controls the domain's resources and profiles. A domain is a collection of one or more chassis that share a common (stacked) fabric and have access to the same network and Input/Output resources.
This test reports the status of the PAN Domain and helps the administrator figure out the following:
- How many chassis and pNodes are present in this domain?
- How many pNodes are currently active among the available pNodes and how well the pNodes are currently utilized in this domain?
Target of the test : An Egenera PAN Manager
Agent deploying the test : A remote agent
Outputs of the test : One set of results for the PAN domain being monitored.
| Parameter | Description |
|---|---|
|
Test Period |
How often should the test be executed. |
|
Host |
The IP address of the Egenera PAN Manager for which this test is to be configured. |
|
PAN Manager User, PAN Manager Password, and Confirm Password |
To monitor the Egenera PAN Manager, the eG agent has to be configured with administrator privileges. This is why, you need to specify the credentials of an administrator against the PAN Manager User and PAN Manager Password parameters of this test. Confirm the pan manager password by retyping it in the Confirm Password text box. |
|
SSL |
By default, the Egenera PAN Manager is not SSL-enabled. Accordingly, the SSL flag is set to No by default. |
|
PAN Manager Webport |
By default, in most environments, the Egenera PAN Manager listens on port 80 (if not SSL-enabled) or on port 443 (if SSL-enabled) only. This implies that while monitoring the Egenera PAN Manager, the eG agent, by default, connects to port 80 or 443, depending upon the SSL-enabled status of Egenera PAN Manager - i.e., if Egenera PAN Manager is not SSL-enabled (i.e., if the SSL flag above is set to No), then the eG agent connects to Egenera PAN Manager using port 80 by default, and if Egenera PAN Manager is SSL-enabled (i.e., if the SSL flag is set to Yes), then the agent-Egenera PAN Manager communication occurs via port 443 by default. Accordingly, the PAN Manager Webport parameter is set to default by default. In some environments however, the default ports 80 or 443 might not apply. In such a case, against the PAN Manager Webport parameter, you can specify the exact port at which the Egenera PAN Manager in your environment listens, so that the eG agent communicates with that port for collecting metrics from the Egenera PAN Manager. |
|
Detailed Diagnosis |
To make diagnosis more efficient and accurate, the eG Enterprise embeds an optional detailed diagnostic capability. With this capability, the eG agents can be configured to run detailed, more elaborate tests as and when specific problems are detected. To enable the detailed diagnosis capability of this test for a particular server, choose the On option. To disable the capability, click on the Off option. The option to selectively enabled/disable the detailed diagnosis capability will be available only if the following conditions are fulfilled:
|
| Measurement | Description | Measurement Unit | Interpretation | ||||||
|---|---|---|---|---|---|---|---|---|---|
|
Is domain contactable? |
Indicates the current status of this PAN Domain. |
|
This measure reports a value Yes if this PAN Domain is currently available and a value No if this PAN Domain is powered off. The numeric values that correspond to the above-mentioned measure values are as follows:
Note: By default, this measure reports the above-mentioned Measure Values while indicating the status of this PAN domain. However, in the graph of this measure, the status will be represented using the corresponding numeric equivalents of the Measure Values. |
||||||
|
Total pNodes |
Indicates the total number of pNodes available in this PAN Domain. |
Number |
A pNode is a physical blade server that provides the CPU processing and memory capabilities for a pServer. |
||||||
|
Active pNodes |
Indicates the number of pNodes that are currently active in this PAN Domain. |
Number |
Use the detailed diagnosis of this measure to know the names of the active pNodes. |
||||||
|
pNode utilization |
Indicates the percentage of pNodes that were utilized in this PAN Domain. |
Percent |
This measure is a good indicator to check the availabilty of the pNodes in this PAN Domain. A low value of this measure indicates that additional resources such as pServer can be added to this domain. A high value however indicates that additional resources cannot be added further to this domain. |
||||||
|
Chassis |
Indicates the number of chassis present in this PAN Domain. |
Number |
The detailed diagnosis capability of this measure if enabled, provides you with the details of the chassis such as the name of the chassis, the current status of the chassis, the number of pNodes in this chassis and the number of switches present in the chassis. |
||||||
|
Powered off pNodes |
Indicates the number of pNodes that are currently powered off in this PAN domain. |
Number |
Use the detailed diagnosis of this measure to know which pNodes are powered off. |
||||||
|
pNodes in other states |
Indicates the number of pNodes that are currently in a state other than the powered on or the powered off state. |
Number |
Use the detailed diagnosis of this measure to know which pNodes are neither in the powered off state nor in the powered on state. |
The detailed diagnosis of the Is domain contactable? measure reports the details of the domain such as the Domain IP, Domain Type, Domain Location and the Domain Model.
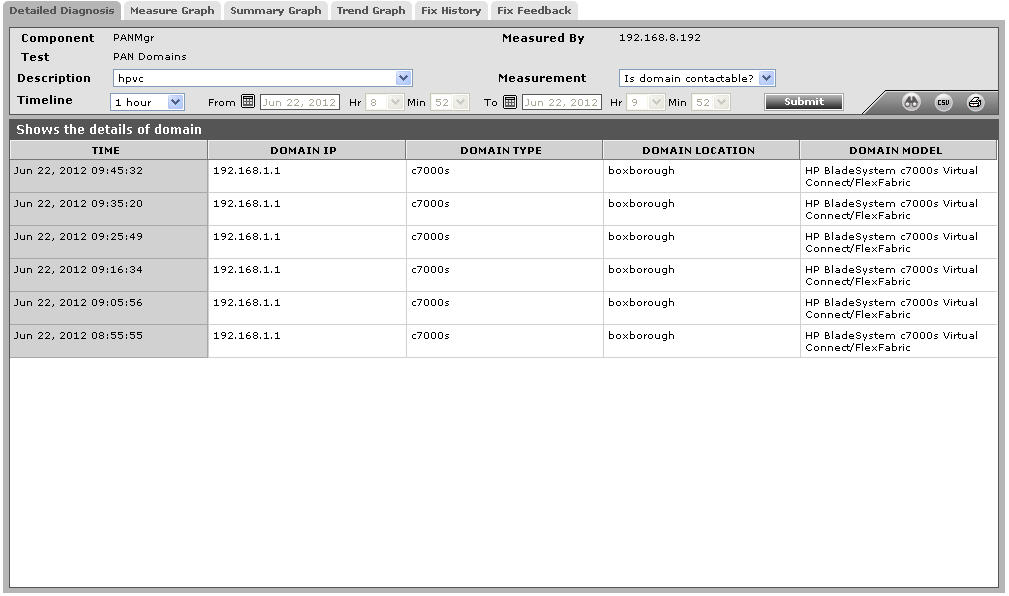
Figure 1 : The detailed diagnosis of the Is domain contactable? measure
The detailed diagnosis capability of the Chassis measure if enabled, provides you with the details of the chassis such as the name of the chassis, the current status of the chassis, the number of pNodes in this chassis and the number of switches present in the chassis.
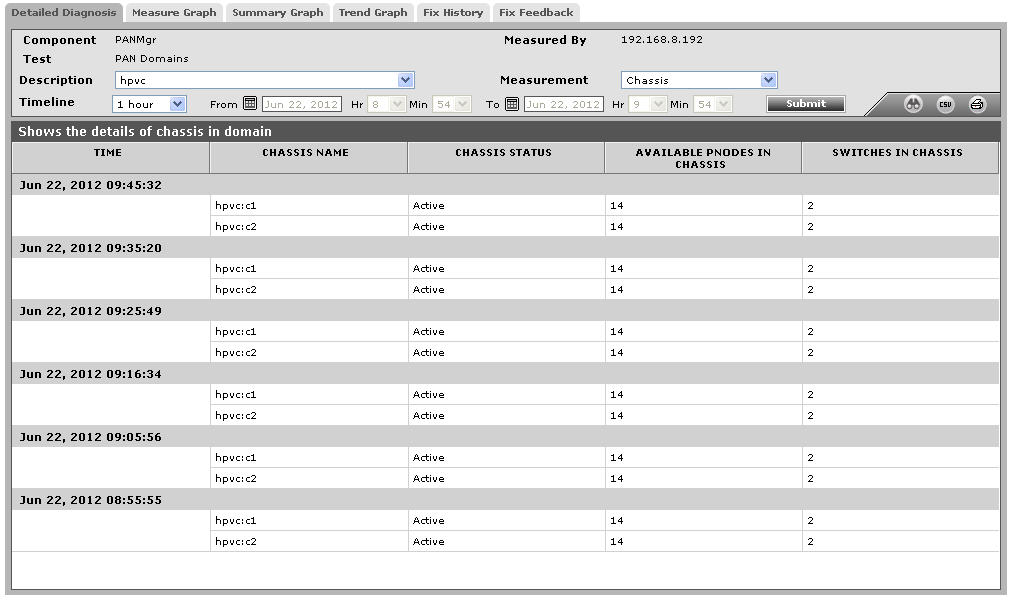
Figure 2 : The detailed diagnosis of the Chassis measure