Pserver Performance Test
A pServer is a logical server that possesses all the resources of a conventional server, but which is not tied to a specific processing resource.
The components of a pServer resemble those of standard servers:
- pNodes — processing power
- vNICs — network access
- vHBAs — storage access
- VCD — CD-ROM drive
A conventional server contains these hardware equivalents in a single box. By contrast, a pServer consists of distributed virtual components that provide the same features. pServers remain flexible and reconfigurable after they are implemented.
This test auto discovers the pServers in the Egenera PAN Manager and help the administrators determine the following:
- The current status of each pServer and the PAN Agent availability on the pServer;
- The management mode of each pServer;
- The number of primary and failover pNodes in every pServer;
- the number of virtual components such as vHBAs and vNICs available in each pServer;
- The CPU and memory usage of each pServer and the level of disk activity and network traffic handled by every pServer; this points you to the resource-hungry pServers in your PAN manager.
Target of the test : An Egenera PAN Manager
Agent deploying the test : A remote agent
Outputs of the test : One set of results for the PAN domain being monitored.
| Parameter | Description |
|---|---|
|
Test Period |
How often should the test be executed. |
|
Host |
The IP address of the Egenera PAN Manager for which this test is to be configured. |
|
PAN Manager User, PAN Manager Password, and Confirm Password |
To monitor the Egenera PAN Manager, the eG agent has to be configured with administrator privileges. This is why, you need to specify the credentials of an administrator against the PAN Manager User and PAN Manager Password parameters of this test. Confirm the pan manager password by retyping it in the Confirm Password text box. |
|
SSL |
By default, the Egenera PAN Manager is not SSL-enabled. Accordingly, the SSL flag is set to No by default. |
|
PAN Manager Webport |
By default, in most environments, the Egenera PAN Manager listens on port 80 (if not SSL-enabled) or on port 443 (if SSL-enabled) only. This implies that while monitoring the Egenera PAN Manager, the eG agent, by default, connects to port 80 or 443, depending upon the SSL-enabled status of Egenera PAN Manager - i.e., if Egenera PAN Manager is not SSL-enabled (i.e., if the SSL flag above is set to No), then the eG agent connects to Egenera PAN Manager using port 80 by default, and if Egenera PAN Manager is SSL-enabled (i.e., if the SSL flag is set to Yes), then the agent-Egenera PAN Manager communication occurs via port 443 by default. Accordingly, the PAN Manager Webport parameter is set to default by default. In some environments however, the default ports 80 or 443 might not apply. In such a case, against the PAN Manager Webport parameter, you can specify the exact port at which the Egenera PAN Manager in your environment listens, so that the eG agent communicates with that port for collecting metrics from the Egenera PAN Manager. |
|
Detailed Diagnosis |
To make diagnosis more efficient and accurate, the eG Enterprise embeds an optional detailed diagnostic capability. With this capability, the eG agents can be configured to run detailed, more elaborate tests as and when specific problems are detected. To enable the detailed diagnosis capability of this test for a particular server, choose the On option. To disable the capability, click on the Off option. The option to selectively enabled/disable the detailed diagnosis capability will be available only if the following conditions are fulfilled:
|
| Measurement | Description | Measurement Unit | Interpretation | ||||||||||||
|---|---|---|---|---|---|---|---|---|---|---|---|---|---|---|---|
|
Boot status |
Indicates the current operating state of this pServer. |
|
If the pServer is booted in this LPAN, then the value of this measure will be reported as Booted. If the pServer is shutdown, then the value of this measure will be reported as Shutdown. The numeric values that correspond to the above-mentioned measure values are as follows:
Note: By default, this measure reports the above-mentioned Measure Values while indicating the current operating state of this pServer. However, in the graph of this measure the state will be represented using the corresponding numeric equivalents i.e., 0 or 1. |
||||||||||||
|
Is PAN agent available? |
Indicates whether/not the PAN Agent is available on this pServer. |
|
A PAN Agent is an application running on the pServer that interprets PAN Manager network configuration changes to the pServer and subsequently invokes the network device configuration utility to update network interfaces on the pServer. The PAN Agent provides graceful shutdowns and basic monitoring of pServer and displays version information for the installed operating system. This measure reports the value Yes if the PAN Agent is running on the pServer or the value No if the PAN Agent is not running. The numeric values that correspond to the above-mentioned values are as follows:
Note: By default, this measure reports the above-mentioned Measure Values while indicating whether/not the PAN Agent is running on this pServer. However, in the graph of this measure, the PAN agent's availability will be represented using the corresponding numeric equivalents of the Measure Values as mentioned in the table above. |
||||||||||||
|
Mode |
Indicates the management mode of this pServer. |
|
PAN Manager features the ability to monitor and control a pServer through the use of a management mode setting. With managed pServers, PAN Manager automatically detects the level of monitoring it can establish with the pServer. PAN Manager offers the following managed modes for pServer administration:
This measure reports one of the above-mentioned values to indicate the current mode of this pServer. The numeric values that correspond to the above-mentioned modes are as follows:
Note: By default, this measure reports the above-mentioned Modes while indicating the current mode of this pServer. However, in the graph of this measure, the mode will be represented using the corresponding numeric equivalents i.e., 0 to 4. |
||||||||||||
|
Primary pNode |
Indicates the total number of primary pNodes currently available in this pServer. |
Number |
From the pNodes previously allocated to the LPAN, the LPAN Administrator assigns a primary pNode to a pServer. The primary pNode can either be a specific pNode, or a pool of pNodes within the LPAN. If the LPAN is authorized to access a global pool, the pServer can obtain a primary pNode from the global pool if the local pool becomes depleted. |
||||||||||||
|
Failover pNode |
Indicates the total number of failover pNodes currently available in this pServer. |
Number |
Failover is the act of restarting a pServer on a different pNode. (Failover requires having a PAN Server Portability license). The failover pNode can either be a specific pNode, or a pool of pNodes within the LPAN. If the LPAN is authorized to access a global pool, the pServer can obtain a failover pNode from the global pool if the local pool becomes depleted. |
||||||||||||
|
Virtual network interface card (vNIC) |
Indicates the number of virtual Network Interface Cards (vNICs) that are currently created on this pServer. |
Number |
vNIC is the Virtual Network Interface Card i.e., in this case, a PAN Manager Ethernet interface you create on a pServer. A vNIC interface functions just like a physical NIC, and is the means by which a pServer connects to an Ethernet network. The detailed diagnosis capability of this measure lists out the names of the vNICs that are created on the pServer. |
||||||||||||
|
Virtual host bus adapter |
Indicates the number of virtual Host Bus Adapters (vHBAs) that are currently created on this pServer. |
Number |
The Virtual Host Bus Adapter (vHBA) is a PAN Manager SAN interface you create on a pServer. A vHBA interface functions like a physical HBA, and is the means by which a pServer connects to a SAN environment. The detailed diagnosis capability of this measure lists out the names of the vHBAs that are created on the pServer. |
||||||||||||
|
Disk block read rate |
Indicates the rate at which the disk blocks are read from this pServer. |
Blocks/Sec |
|
||||||||||||
|
Disk block write rate |
Indicates the rate at which the disk blocks are written to this pServer. |
Blocks/Sec |
|
||||||||||||
|
Disk read rate |
Indicates the rate at which the disk is read from this pServer. |
Ops/Sec |
Compare the values of these measures across pServers to identify the I/O-intensive pServers. |
||||||||||||
|
Disk write rate |
Indicates the rate at which the disk is written to this pServer. |
Ops/Sec |
|||||||||||||
|
User CPU utilization |
Indicates the percent of CPU by this pServer for user-level processing. |
Percent |
|
||||||||||||
|
System CPU utilization |
Indicates the percentage of CPU utilized by this pServer for system-level processing. |
Percent |
|
||||||||||||
|
Idle CPU |
Indicates the percentage of CPU in this pServer that is idle. |
Percent |
|
||||||||||||
|
CPU utilization |
Indicates the overall CPU usage of this pServer. |
Percent |
Ideally, the value of this measure should be low. A high value is indicative of excessive CPU usage by the pServer. Compare the value of this measure across pServers to determine which pServer is utilizing the maximum CPU resources. You can then compare the value of the User CPU utilization and System CPU utilization measures for that pServer to know where the pServer is spending more CPU - in running user processes or in performing system-level processing. |
||||||||||||
|
User nice CPU utilization |
|
|
|
||||||||||||
|
Total memory |
Indicates the total memory available in this pServer. |
MB |
|
||||||||||||
|
Free memory |
Indicates the amount of memory that is available for use in this pServer. |
MB |
A high value is desired for this measure. |
||||||||||||
|
Used memory |
Indicates the amount of memory that is currently in use on this pServer. |
MB |
A low value is desired for this measure. |
||||||||||||
|
Memory utilization |
Indicates the percentage of memory utilized by this pServer. |
Percent |
A high value is indicative of excessive memory usage by a pServer. Compare the value of this measure across pServers to identify the memory-intensive pServers. |
||||||||||||
|
Total swap memory |
Indicates the amount of memory that is available for swap in this pServer. |
MB |
|
||||||||||||
|
Free swap memory |
Indicates the amount of swap memory that is available for use in this pServer. |
MB |
A high value is desired for this measure, as a consistent decrease in this value is a sign of excessive swap usage, which in turn signals a memory bottleneck. |
||||||||||||
|
Used swap memory |
Indicates the amount of swap memory that is currently utilized by this pServer. |
MB |
Significant or consistent memory swapping indicates that the pServer is severely overcommitted and that performance degradation is imminent or actively occurring. |
||||||||||||
|
Swap memory utilization |
Indicates the percentage of swap memory that is utilized by this pServer. |
Percent |
A high value is indicative of a contention for memory resources on the pServer. By comparing the value of this measure across pServers, you can accurately identify the pServer that is using swap memory excessively. |
||||||||||||
|
Packets receive rate |
Indicates the rate at which the packets are received by this pServer. |
Packets/Sec |
A high value for these measures is indicative of high bandwidth usage by the pServer. |
||||||||||||
|
Packets send rate |
Indicates the rate at which the packets are sent from this pServer. |
Packets/Sec |
|||||||||||||
|
Carrier detect failures |
Indicates the rate at which the packets failed in this pServer. |
Failures/Sec |
Ideally, the value of this measure should be 0. |
||||||||||||
|
Packets received |
Indicates the number of packets received by this pServer. |
Packets |
|
||||||||||||
|
Packets sent |
Indicates the number of packets sent by this pServer. |
Packets |
|
||||||||||||
|
Data received |
Indicates the number of bytes received by this pServer |
Bytes |
|
||||||||||||
|
Data sent |
Indicates the number of bytes sent by this pServer. |
Bytes |
|
||||||||||||
|
Compressed packets received |
Indicates the amount of compressed packets received by this pServer. |
Packets |
|
||||||||||||
|
Compressed packets sent |
Indicates the number of compressed packets sent by this pServer. |
Packets |
|
||||||||||||
|
Data receive drops |
Indicates the number of data packets that were dropped while data is being received in this pServer. |
Packets |
Ideally, the value of this measure should be zero. |
||||||||||||
|
Data receive errors |
Indicates the number of error packets present in the data that was received by this pServer. |
Packets |
Ideally, the value of this measure should be zero. |
||||||||||||
|
Data receive overruns |
Indicates the number of overrun packets present in the data that was received by this pServer. |
Packets |
|
||||||||||||
|
Data send drops |
Indicates the number of data packets that were dropped while data is sent from this pServer. |
Packets |
Ideally, the value of this measure should be zero. |
||||||||||||
|
Data send errors |
Indicates the number of error packets present in the data that was sent by this pServer. |
Packets |
Ideally, the value of this measure should be 0. |
||||||||||||
|
Data send overruns |
Indicates the number of overrun packets present in the data that was sent by this pServer. |
Packets |
|
The detailed diagnosis capability of the Virtual host bus adapter measure lists out the names of the vHBAs that are created on the pServer.
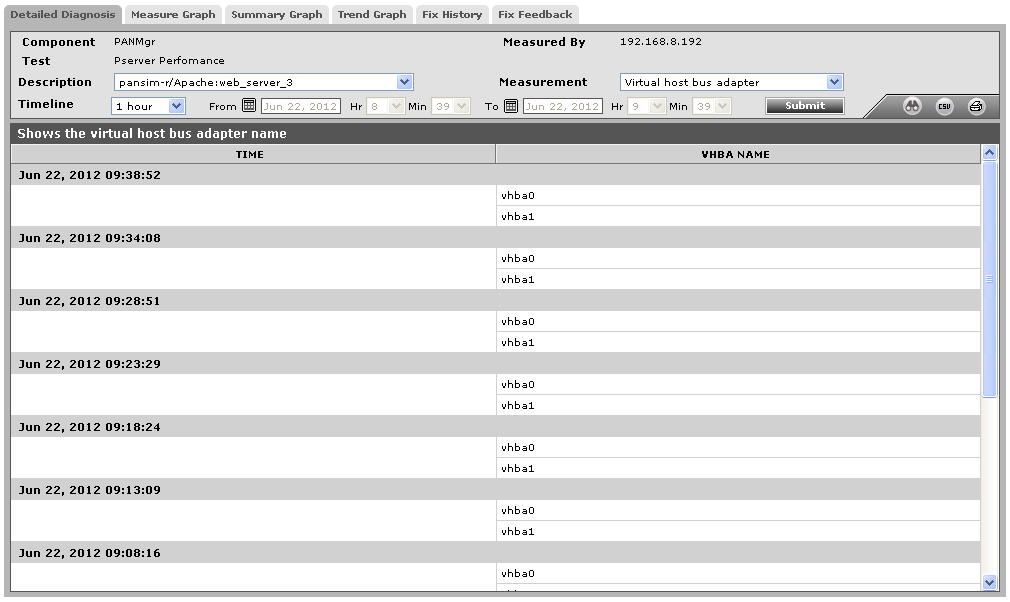
Figure 1 : The detailed diagnosis of the Virtual host bus adapter measure