Monitoring Elasticsearch Server Using eG Enterprise
eG Enterprise provides a specialized Elasticsearch monitoring model that monitors the health, index health, search performance of the Elasticsearch, and promptly captures and reports abnormalities.
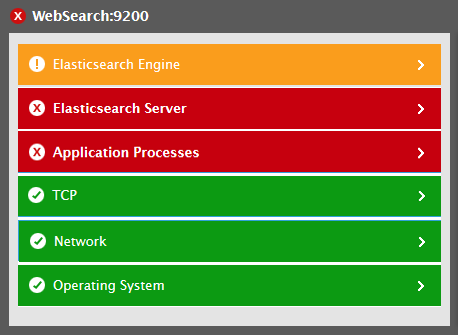
Figure 1 : The layer model of Elasticsearch server
Every layer of the layer model above is mapped to a variety of tests to collect performance metrics of the Elasticsearch server. Analyzing the metrics reported by the tests, administrators can find out the accurate answers for the following queries:
- Is the target server connected?
- What is the current health of the Elasticsearch cluster?
- How many active primary shards are in the Elasticsearch cluster?
- How many secondary shards are created in the cluster?
- How many data nodes are in the cluster?
- What is the current health of each index on the cluster?
- What is the indexing rate of each index?
- What is the count of documents that were added to/deleted from each index?
- How many refresh/merge/flush operations are performed in each index?
- How long each index took for performing refresh/merge/flush operations?
- How many primary shards are in each index?
- How many secondary shards are created for the primary shards in each index?
- What is the count of indexes in the normal/warning/critical states?
- How many indexes are currently in relocating and initializing states?
- What is the rate at which the search queries were processed at each index?
- How many number of query evictions were performed in the query cache and fielddata cache?
- What is the size of query cache and fielddata cache in each index?
- How many threads are currently busy? Does the server appear to be handling too much load?
Since the tests mapped to the bottom 4 layers of the layer model (Figure 1) are elaborately dealt in the Unix and Windows Servers