Adding a New Policy
To add a new policy, do the following:
-
Click on the
 icon in the test configuration page of the Application Event Log test, Application Events test, System Events test, System Event Log test, or Security Log test (see Figure 1).
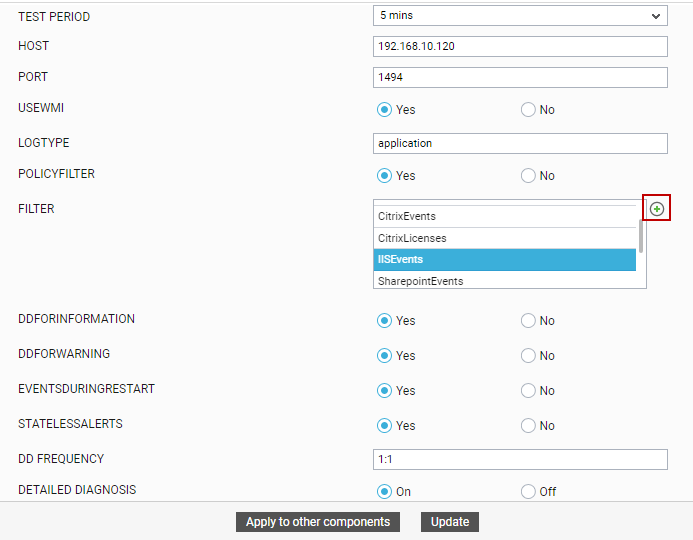
-
Figure 2 will then appear listing the policies that pre-exist.
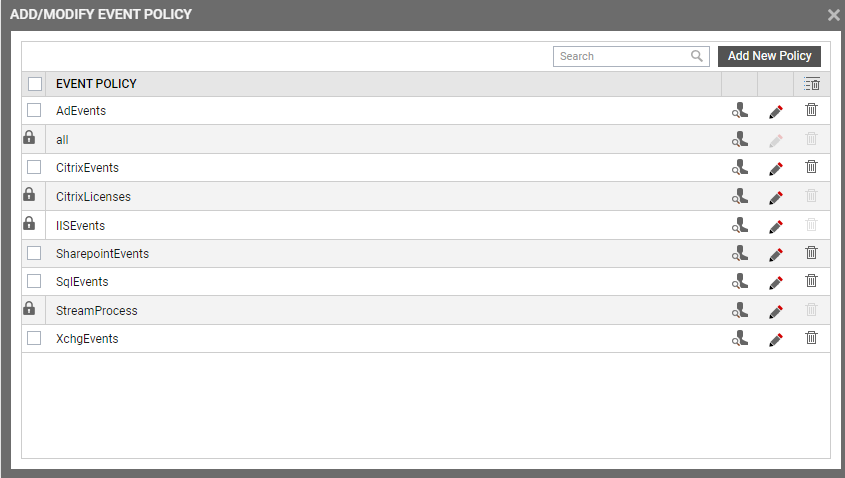
- To view the contents of a policy, click on the
 icon against the policy name. While a policy can be modified by clicking on the
  icon, it can be deleted using the
  icon. The default policy is all, which can only be viewed and not modified or deleted. The specification contained within this policy is: all:none:all:none:all:none.
 -
To create a new policy, click on the Add New Policy button in Figure 2. Doing so invokes Figure 3, using which a new policy can be created.
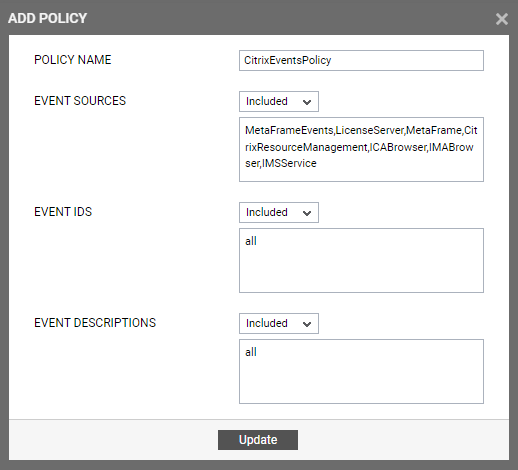
- In Figure 3, first, provide a unique name against POLICY NAME.
-
To include one/more event sources for monitoring, select Included from the EVENT SOURCES drop-down list, and then specify a comma-separated list of event sources to be included in the text box under the drop-down list.
-
To exclude specific event sources from monitoring, select Excluded from the EVENT SOURCES drop-down list, and then specify a comma-separated list of event sources to be excluded in the text box under the drop-down list.
Note:
At any given point in time, you can choose to either Include or Exclude event sources, but you cannot do both. If you have chosen to include event sources, then the eG Enterprise system automatically assumes that no event sources need be excluded. Accordingly, the {event_sources_to_be_excluded} section of the filter format mentioned above, will assume the value none. Similarly, if you have chosen to exclude specific event sources from monitoring, then the {event_sources_to_be_included} section of the format above will automatically take the value all, indicating that all event sources except the ones explicitly excluded, will be included for monitoring.
- In the same way, select Included from the EVENT IDS list and then, provide a comma-separated list of event IDs to be included in the text box under the drop-down list.
-
If you, on the other hand, want to exclude specific event IDs from monitoring, then first select Excluded from the EVENT IDS list box, and then provide a comma-separated list of event IDs to be excluded in the text box under the drop-down list.
Note:
At any given point in time, you can choose to either Include or Exclude event IDs, but you cannot do both. If you have chosen to include event IDs, then the eG Enterprise system automatically assumes that no event IDs need be excluded. Accordingly, the {event_IDs_to_be_excluded} section of the filter format mentioned above, will assume the value none. Similarly, if you have chosen to exclude specific event IDs from monitoring, then the {event_IDs_to_be_included} section of the format above will automatically take the value all, indicating that all event IDs except the ones explicitly excluded, will be included for monitoring.
- Likewise, select Included from the EVENT DESCRIPTIONS list and then, provide a comma-separated list of event descriptions to be included in the text box under the drop-down list.
-
For excluding specific event descriptions from monitoring, first select Excluded from the EVENT DESCRIPTIONS list box, and then provide a comma-separated list of event descriptions to be excluded in the text box under the drop-down list.
Note:
- Instead of the complete event descriptions, wild card-embedded event description patterns can be provided as a comma-separated list in the Included or Excluded text boxes. For instance, to include all events that start with st and vi, your Included specification should be: st*,vi*. Similarly, to exclude all events with descriptions ending with ed and le, your Excluded specification should be: *ed,*le.
- At any given point in time, you can choose to either Include or Exclude event descriptions/users, but you cannot do both. If you have chosen to include event descriptions/users, then the eG Enterprise system automatically assumes that no event descriptions/users need be excluded. Accordingly, the {event_descriptions_to_be_excluded} section or the {users_to_be_excluded} section (as the case may be) of the filter formats mentioned above, will assume the value none. Similarly, if you have chosen to exclude specific event descriptions/users from monitoring, then the {event_descriptions_to_be_included} section or the {users_to_be_included} section (as the case may be) of the formats above will automatically take the value all. This indicates that all event descriptions/users except the ones explicitly excluded, will be included for monitoring.
- In case of the Security Log test however, you will not be required to include/exclude event descriptions. Instead, an event users field will appear, using which you need to configure users who need to be included/excluded from monitoring.
- Finally, click the Update button.
-
The results of the configuration will then be displayed as depicted by Figure 4.
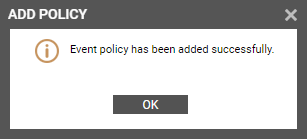
Figure 4 : Results of the configuration
Note:
If you have configured a policy to Include a few/all events (sources/IDs/descriptions/users), and Exclude none, then, while reconfiguring that policy, you will find that the Include option is chosen by default from the corresponding drop-down list in Figure 3. On the other hand, if you have configured a policy to Exclude a few specific events and Include all events, then, while modifying that policy, you will find the Exclude option being the default selection in the corresponding drop-down list in Figure 3.