Security Log Test
The Security Log test reports statistics relating to the Windows security log audits. Note that this test will not work on Windows Vista.
Target of the test : Any host system
Agent deploying the test : An internal agent
Outputs of the test : One set of results for the server being monitored.
| Parameter | Description |
|---|---|
|
Test period |
How often should the test be executed |
|
Host |
The IP address of the host for which this test is to be configured. |
|
Port |
Refers to the port used by the EventLog Service. Here it is null. |
|
LogType |
Refers to the type of event logs to be monitored. The default value is security. |
|
SuccessEventsinDD |
By default, this parameter displays none, indicating that by default none of the successful log audits will be reflected in the detailed diagnosis. If you set this parameter to, say 10, then the test will display only the 10 most recent successful log audits in the detailed diagnosis page. Setting this parameter to all, on the other hand will make sure that all successful log audits are listed in the detailed diagnosis. |
|
FailureEventsinDD |
By default, this parameter displays all, indicating that by default all the failed log audits will be reflected in the detailed diagnosis. If you set this parameter to, say 10, then the test will display only the 10 most recent log audits that failed, in the detailed diagnosis page. Setting this parameter to none, on the other hand will make sure that none of the failed log audits are listed in the detailed diagnosis. |
|
UseWMI |
The eG agent can either use WMI to extract event log statistics or directly parse the event logs using event log APIs. If the UseWMI flag is Yes, then WMI is used. If not, the event log APIs are used. This option is provided because on some Windows NT/2000 systems (especially ones with service pack 3 or lower), the use of WMI access to event logs can cause the CPU usage of the WinMgmt process to shoot up. On such systems, set the UseWMI parameter value to No. On the other hand, when monitoring systems that are operating on any other flavor of Windows (say, Windows 2003/XP/2008/7/Vista/12), the UseWMI flag should always be set to ‘Yes’. |
|
Policy Based Filter |
Using this page, administrators can configure the event sources, event IDs, and event descriptions to be monitored by this test. In order to enable administrators to easily and accurately provide this specification, this page provides the following options:
For explicit, manual specification of the filter conditions, select the No option against the Policy Based Filter field. To choose from the list of pre-configured filter policies, or to create a new filter policy and then associate the same with the test, select the Yes option against the Policy Based Filter field. This is the default selection. |
|
Filter |
If the Policy based Filter flag is set to No, then a Filter text area will appear, wherein you will have to specify the event sources, event IDs, and event users to be monitored. This specification should be of the following format: {Displayname}:{event_sources_to_be_included}:{event_sources_to_be_excluded}:{event_IDs_to_be_included}:{event_IDs_to_be_excluded}:{users_to_be_included}:{ users_to_be_excluded}. For example, assume that the Filter text area takes the value, OS_events:all:Browse,Print:all:none:all:none. Here:
Note: The event sources and event IDs specified here should be exactly the same as that which appears in the Event Viewer window. On the other hand, if the Policy Based Filter flag is set to Yes, then a Filter list box will appear, displaying the filter policies that pre-exist in the eG Enterprise system. A filter policy typically comprises of a specific set of event sources, event IDs, and users to be monitored. This specification is built into the policy in the following format: {Policyname}:{event_sources_to_be_included}:{event_sources_to_be_excluded}:{event_IDs_to_be_included}:{event_IDs_to_be_excluded}:{users_to_be_included}:{users_to_be_excluded} To monitor a specific combination of event sources, event IDs, and users, you can choose the corresponding filter policy from the Filter list box. Multiple filter policies can be so selected. Alternatively, you can modify any of the existing policies to suit your needs, or create a new filter policy. To facilitate this, a Click here link appears just above the test configuration section, once the Yes option is chosen against Policy Based Filter. Clicking on the Click here link leads you to a page where you can modify the existing policies or create a new one. The changed policy or the new policy can then be associated with the test by selecting the policy name from the Filter list box in this page. |
|
DD Frequency |
Refers to the frequency with which detailed diagnosis measures are to be generated for this test. The default is 1:1. This indicates that, by default, detailed measures will be generated every time this test runs, and also every time the test detects a problem. You can modify this frequency, if you so desire. Also, if you intend to disable the detailed diagnosis capability for this test, you can do so by specifying none against DD Frequency. |
|
Detailed Diagnosis |
To make diagnosis more efficient and accurate, the eG Enterprise embeds an optional detailed diagnostic capability. With this capability, the eG agents can be configured to run detailed, more elaborate tests as and when specific problems are detected. To enable the detailed diagnosis capability of this test for a particular server, choose the On option. To disable the capability, click on the Off option. The option to selectively enabled/disable the detailed diagnosis capability will be available only if the following conditions are fulfilled:
|
| Measurement | Description | Measurement Unit | Interpretation |
|---|---|---|---|
|
Successful audits |
Indicates the number of successful audits of windows security logs. |
Number |
The detailed diagnosis of this measure, if enabled, provides the details of the successful log audits. |
|
Failure audits |
Indicates the number of windows security log audits that failed. |
Number |
The detailed diagnosis of this measure, if enabled, provides the details of the failed log audits. |
The detailed diagnosis of the Successful audits measure, if enabled, provides the details of the successful log audits.
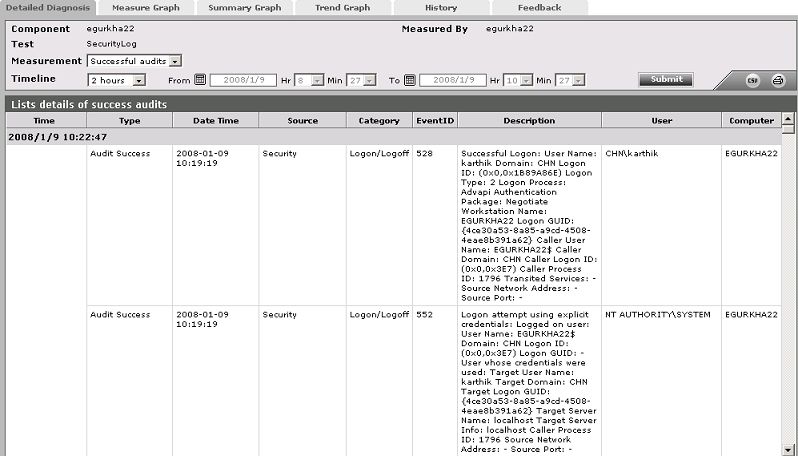
Figure 1 : The detailed diagnosis of the Successful audits measure