Monitoring Forefront TMG
eG Enterprise offers a specialized model for monitoring the Forefront TMG and reporting the following key statistics that aid the administrators to proactively detect potential firewall problems in their network.
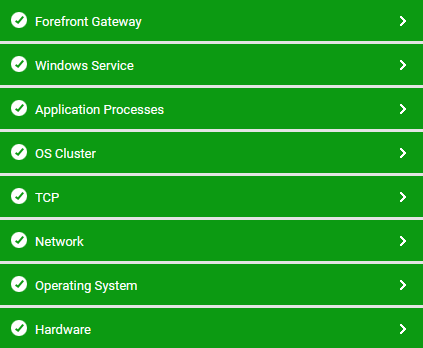
Figure 3 : The layer model of the Forefront TMG
Each layer of is mapped to a series of tests that report a wealth of performance data of the Forefront TMG. Using these tests, you can accurately figure out the following:
- How well the content caching capability is utilized by Forefront TMG?
- What is the rate at which data is retrieved from the disk/memory that is allocated for content caching?
- How many times the disk has failed?
- What is the rate at which data is written to the disk?
- How many URLs were retrieved per second from the disk/memory?
- How many packets of data were sent? and how many packets were allowed through this firewall?
- Are there any packets that were backlogged and dropped?
- How many active connections are created?
- Are there any active sessions for this firewall service?
- How many active SIP registrations are available for this firewall service?
- What is the number of TCP/UDP connections made through this firewall service?
- How well the data is read/written for this firewall service?
- How many H.323 calls are being made? How efficiently the H.323 filter handles the calls?
- Is the SOCKS filter capable of handling active connections/sessions?
- How many DNS resolutions are pending/successful when going through the SOCKS filter?
- How well the Forefront TMG acts as a web proxy?
- What is the time taken to service a web proxy client request? How fast the request can be serviced?
The Operating System, Network, TCP, Application Processes and Windows Service layers of the Forefront TMG are similar to that of a Windows Generic server model.