Monitoring GemFire Cluster using eG Enterprise
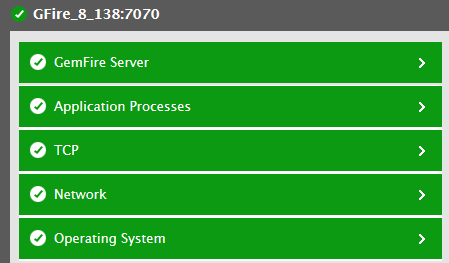
eG Enterprise offers an exclusive GemFire Cluster monitoring model (see Figure 1), which keeps tabs on the availability, I/O processing capability, the read/write latency of the disks, the JVM related statistics of each disk of the server, detects abnormalities, and helps administrators take remedial measures in due course.

Figure 1 : The layer model of the GemFire Cluster
Each layer of Figure 1 is mapped to a wide variety of tests that report a wealth of performance tests using which administrators can find quick and accurate answers to the following performance queries:
- How many cache members are associated with each GemFire region?
- How well data is read from and written to each region?
- How well data is read from and written to the disks associated with each region?
- How well data is read from and written to each disk of the target GemFire cluster?
- What is the average time taken to flush data from each disk?
- What is the total amount of data utilized by each disk?
- How many times the JVM of each disk was suspended?
- How many threads are currently in use in the JVM of each disk?
- What is the percentage of heap memory utilized on the JVM of each disk?
- How many garbage collection operation were performed on the JVM of each disk?
- What is the time taken to perform the garbage collection operation on the JVM of each disk?
- What is the amount of heap memory allocated to the JVM of each disk?
- Is each member of each resource running?
- Was the member of the resource rebooted?
- How well the CPU of each member belonging to a resource was utilized?
- How many regions were present in the cache allocated to each member?
- How well data was read from and written to the cache allocated to each member?
- What is the average rate at which data was read from and written to the cache allocated to each member?
- How many clients were connected to each member?
- How many backend servers were communicating with the GemFire server?
- What is the maximum number of connections allowed on the server?
- What is the maximum number of threads allowed to service user requests?
- What is the maximum time taken by the server to cater to user requests?
- How many virtual machines are connected to the GemFire cluster?
- How many connections are waiting for a thread?
- How many connections failed to connect to the GemFire cluster?
Since the Network layer has been discussed extensively in Monitoring Unix and Windows Servers document, let us now discuss the tests pertaining to the remaining layers mentioned in Figure 1 in detail in the forthcoming sections.