Monitoring the Oracle GlassFish Enterprise Server
eG Enterprise provides a specialized GlassFish monitoring model that monitors the health of the Oracle GlassFish server inside-out and promptly captures and reports abnormalities.
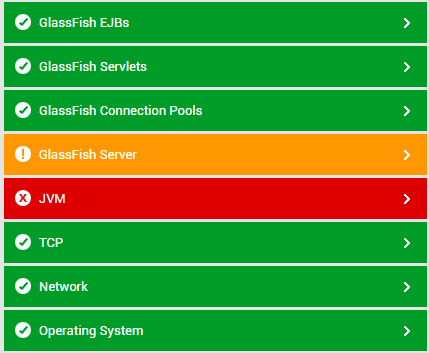
Figure 1 : The layer model of the GlassFish server
Every layer of Figure 1 above is mapped to a variety of tests; each of these tests can be configured to use agent-based or agentless methodologies to report on the health of key components of the application server such as the servlets, EJBs, connection pools, caches, the JVM, and more!
Once the pre-requisites discussed in Pre-requisites for Monitoring Oracle GlassFish Enterprise Server are fulfilled, the eG agent will execute the tests and collect the desired performance metrics from the GlassFish server. Using the statistics reported by these tests, administrators can find quick and accurate answers for the following performance queries:
- Is any application deployed on the server experiencing a request overload? If so. which application is this?
- Is any application processing requests slowly? Which application is this and what is causing the processing delay - is it because of poorly responsive servlets? is it because of JSP errors? is it owing to EJB caches running out of beans or EJB-related errors? is it because of one/more inefficient EJB methods? Which servlet/JSP/EJB cache/EJB pool/EJB method is contributing to this slowdown?
- Did any application send out an error response recently?
- Which application is overloaded with sessions?
- Has any application rejected any sessions?
- Are all thread pools utilizing threads optimally? Are any thread pools guilty of ineffective thread usage?
- Do the thread pools have adequate threads to handle the request load?
- Are transaction rollbacks kept at a minimum?
- Are requests to any connection pool waiting a long time for connections? Are too many such requests in waiting? Is it because there are not enough connections in the pool to service the requests?
- Has a potential connection leak been detected in any pool?
The bottom four layers of the layer model have been dealt with in the Unix and Windows Servers