Google Cloud BigTable Details Test
Google Cloud Bigtable is a fully managed, highly scalable NoSQL database with single-digit millisecond latency, limitless scale, and 99.999% availability for large analytical and operational workloads. Bigtable is a sparsely populated table that can scale to billions of rows and thousands of columns, enabling you to store terabytes or even petabytes of data. A single value in each row is indexed; this value is known as the row key. Bigtable is ideal for applications that need high throughput and scalability for key/value data, where each value is typically no larger than 10 MB. Bigtable also excels as a storage engine for batch MapReduce operations, stream processing/analytics, and machine-learning applications.
The following diagram shows a simplified version of Bigtable's overall architecture:
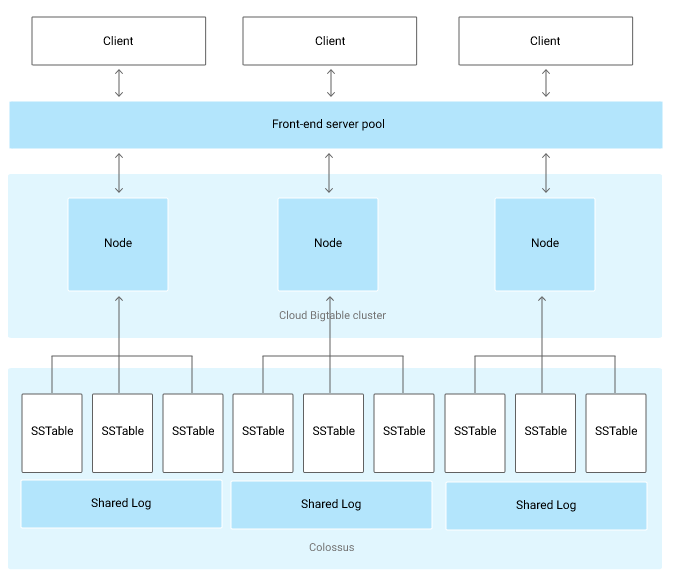
As illustrated in the architecture, all client requests go through a frontend server before they are sent to a Bigtable node (also known as "tablet servers"). The nodes are organized into a Bigtable cluster, which belongs to a Bigtable instance, a container for the cluster. Each node in the cluster handles a subset of the requests to the cluster. By adding nodes to a cluster, you can increase the number of simultaneous requests that the cluster can handle. Adding nodes also increases the maximum throughput for the cluster.
Monitoring the Bigtable instances is essential to track the performance of Bigtable instance state, latency, request failures, data consumption and resource utilization such as CPU and storage utilization. The Google Cloud BigTable Details test monitors each Bigtable instance and reports the performance metrics that help administrators to identify bottlenecks and prevent and resolve failures at the earliest. In addition, administrators are also alerted to request failures encountered by tables, over-utilization of CPU and storage resource and excessive data consumption.
Note:
This test will report metrics only if the Cloud Bigtable Admin API is enabled in the target Google Cloud project. If you want to know how to turn on a service API in the Google Cloud project, refer Enabling Service APIs.
Target of the test : Google Cloud
Agent deploying the test : A remote agent
Outputs of the test : One set of the results for each Bigtable instance in the target Google Cloud
| Parameters | Description |
|---|---|
|
Test Period |
How often should the test be executed. |
|
Host |
The host for which the test is to be configured. |
|
Private Keyfile Name |
To connect to the Google Cloud Project in which the services are running, the eG agent requires a private key of a service account with Compute Viewer, Monitoring Viewer, and Cloud Asset Viewer roles in the target project. If a service account pre-exists in the project, then you can download the private key as a JSON file. Save this JSON file in the <eG_Install_Dir>/agent/lib folder and provide the name of that file against this parameter. However, if no such service account pre-exists, you will have to create one for monitoring the project. To know how to create a service account and download its private key, refer to How does eG Enterprise Monitor Google Cloud?. |
|
Detailed Diagnosis |
To make diagnosis more efficient and accurate, the eG Enterprise embeds an optional detailed diagnostic capability. With this capability, the eG agents can be configured to run detailed, more elaborate tests as and when specific problems are detected. To enable the detailed diagnosis capability of this test for a particular server, choose the On option. To disable the capability, click on the Off option. The option to selectively enable/disable the detailed diagnosis capability will be available only if the following conditions are fulfilled:
|
| Measurement | Description | Measurement Unit | Interpretation | ||||||||
|---|---|---|---|---|---|---|---|---|---|---|---|
|
State |
Indicates the current status of this Bigtable instance. |
|
The values reported by this measure and its numeric equivalents are mentioned in the table below:
Note: By default, this measure reports the Measure Values listed in the table above to indicate the current status of each Bigtable instance. In the graph of this measure however, the same is represented using the corresponding numeric equivalents only. |
||||||||
|
Type |
Indicates the type of this Bigtable instance. |
|
The values reported by this measure and its numeric equivalents are mentioned in the table below:
Note: By default, this measure reports the Measure Values listed in the table above to indicate the type of each Bigtable instance. In the graph of this measure however, the same is represented using the corresponding numeric equivalents only. |
||||||||
|
Total clusters |
Indicates the total number of clusters in this instance. |
Number |
|
||||||||
|
Total tables |
Indicates the total number of tables in this instance. |
Number |
The detailed diagnosis of this measure reveals the name of each table and the detains of the small storage units in the tables. |
||||||||
|
Total backup storage used |
Indicates the total number of backup storage in this instance. |
|
Bigtable backups let you save a copy of a table's schema and data and then restore to a new table at a later time. Using backups and backup copies, you can restore to a new table in any region or project where you have a Bigtable instance, regardless of where the source table is. |
||||||||
|
Maximum nodes in autoscaled cluster |
Indicates the maximum number of nodes that this Bigtable instance can allow the cluster to scale up to when autoscaling is enabled. |
Number |
|
||||||||
|
Minimum nodes in autoscaled cluster |
Indicates the maximum number of nodes that this Bigtable instance can allow the cluster to scale down to when autoscaling is enabled. |
Number |
|
||||||||
|
Recommended nodes on autoscaled cluster based on CPU usage |
Indicates the number of nodes that this Bigtable instance recommends for the cluster based on the CPU utilization target. |
|
This metric is visible only when autoscaling is enabled for the cluster. If the value of this measure is higher than the Maximum nodes in autoscaled cluster measure, consider raising your CPU utilization target or increasing the maximum number of nodes for the cluster. If the value of this measure is lower than the Minimum nodes in autoscaled cluster measure, the cluster might be overprovisioned for your usage, and you should consider lowering the minimum. |
||||||||
|
Recommended nodes on autoscaled cluster based on storage usage |
Indicates the number of nodes that this Bigtable instance recommends for the cluster based on the built-in storage utilization target. |
Number |
This metric is visible only when autoscaling is enabled for the cluster. If this value is higher than the Maximum nodes in autoscaled cluster measure, consider increasing the maximum number of nodes for the cluster. |
||||||||
|
CPU load of a cluster |
Indicates the average percentage of CPU utilization across all nodes in the cluster in this instance. |
Percent |
A low value is desired for this measure. |
||||||||
|
CPU load of a cluster splited by app profile |
Indicates the percentage of CPU used by app profile, method and table on this instance. |
Percent |
You can use this value of this measure to determine if the CPU usage of a particular app profile, API method, or table is driving the CPU load in case the value of this measure is found to be higher than the expected CPU usage for a cluster. |
||||||||
|
CPU load of the busiest cluster |
Indicates the percentage of CPU used by the busiest node in the cluster. |
Percent |
|
||||||||
|
HDD disk utilization |
Indicates the percentage of disk space used for processing HDD reads on the cluster (if it is a HDD cluster) in this instance. |
Percent |
If the value of this measure is close to 100%, then you might experience increased latency. To avoid such inconveniences, you may need to add nodes to the cluster to reduce the disk usage percentage. |
||||||||
|
Total nodes |
Indicates the number of nodes in this instance. |
Number |
|
||||||||
|
Storage utilization |
Indicates the percentage of storage utilized on this instance. |
Percent |
A high value for this measure indicates that the storage space on the Bigtable instance is depleting rapidly and immediate attention required to avoid any disruptions in the operations. |
||||||||
|
Used storage space |
Indicates the amount of storage space utilized on this instance. |
MB |
A low value is desired for this measure. |
||||||||
|
Total storage space |
Indicates the total amount of disk storage allocated for this instance. |
GB |
|
||||||||
|
Average replication latencies for a table |
Indicates the average latency encountered by a table in this instance. |
Percent |
Ideally, the value of this measure should be low. |
||||||||
|
Free storage space |
Indicates the amount of storage space available for use by the clusters in this instance. |
GB |
A sudden decrease in this value could indicate an unexpected/sporadic spike in the space utilization on the instance. A consistent decrease however could indicate a gradual, yet steady erosion of storage space, and is hence a cause for concern. |
||||||||
|
Maximum time taken for replication between clusters |
Indicates the maximum time that can be taken to perform replication between the clusters in this instance. |
Milliseconds |
A low value is desired for this measure. |
||||||||
|
Server requests failed for a table |
Indicates the number of requests to a table in this instance failed during the last measurement period. |
Number |
Ideally, the value of this measure should be very low. |
||||||||
|
Rows modified by the server requests for a table |
Indicates the number of rows modified in a table while processing the requests during the last measurement period. |
Number |
|
||||||||
|
Failovers during multicluster requests |
Indicates the number of failovers occurred while processing the requests by multi-cluster in this instance during the last measurement period. |
Number |
A low value is desired for this measure. |
||||||||
|
Request data received by the server for a table |
Indicates the number of bytes received by a table in this instance while processing server requests during the last measurement period. |
Bytes |
|
||||||||
|
Total server request for a table |
Indicates the total number of server requests received by a table in this instance. |
Number |
|
||||||||
|
Rows returned by server requests for a table |
Indicates the number of rows that were returned by the server requests for a table in this instance during the last measurement period. |
Number |
|
||||||||
|
Response data sent by the server for a table |
Indicates the number of response bytes sent by the server to a table in this this instance. |
Bytes |
|
||||||||
|
Data stored in a table |
Indicates the amount of compressed data stored in the tables in this instance. |
MB |
|