Monitoring HA Proxy Server
eG Enterprise provides a specialized HA Proxy Server monitoring model (see Figure 1), which periodically pulls out a wealth of information about the health of the proxy server, and the key metrics related to the status of the proxy server, sessions created by each proxy service and data transmitted to/from each proxy service.
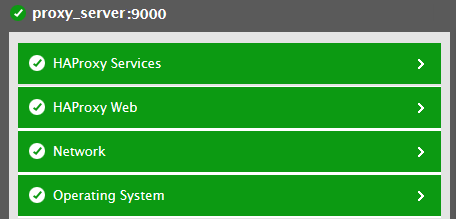
Figure 1 : Layer model of a HA Proxy server
Using the metrics reported, administrators can find quick and accurate answers for the following performance questions:
- What is the availability and responsiveness of the proxy server?
- How well the connections were established on the proxy server per second?
- What is the maximum memory utilized per process on the proxy server?
- How many sockets, pipes and connections are available per process on the proxy server?
- What is the current status of each proxy service?
- How many sessions were established through each proxy service?
- How many connections were established through each proxy service?
- How many HTTP responses were received with response code from the proxy server for the HTTP requests through each proxy service?
- What is the amount of data received/transmitted through each proxy service?
- How many connections were denied by the proxy server through each proxy service?
-
How many error prone requests were received through each proxy service on the proxy server?
- What is the total downtime on each proxy service?
- What is the status of the last health check performed on each proxy service?
- How many time connections were retried to the proxy server through each proxy service?
Since the tests pertaining to the Network and HAProxy Web layers have already been discussed in the Monitoring Unix and Windows Servers document, the sections to come will discuss the tests associated with the remaining layers only.