Monitoring Hadoop
eG Enterprise provides a specialized monitoring model for Hadoop.

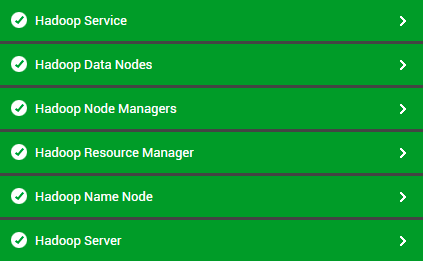
Figure 4 : Layer model of the Hadoop cluster
Each layer of Figure 1 is mapped to tests that monitor the heath of the DataNodes, NameNode, and ResourceManager of the cluster, and report anomalies (if any). Using the metrics reported by these tests, administrators can find quick and accurate answers for these performance queries:
- Are there any corrupt data blocks?
- Are any blocks missing?
- Do any blocks have insufficient replication?
- Are all DataNodes processing I/O requests quickly? Is any DataNode too lethargic in processing I/O?
- Did block verification fail on any DataNode?
- Is any DataNode sending heartbeats irregularly to the NameNode?
- Has any DataNode stopped sending heartbeats to the NameNode?
- Is any DataNode sending heartbeats slowly to the NameNode?
- Are blocks evicted at regular intervals from DataNodes to make room for new entries? Is any DataNode holding blocks in-memory for too long a time?
- Are too many incremental block report operations occurring on any DataNode?
- Is any DataNode unusually slow in performing block report operations?
- Is the Secondary NameNode taking an abnormally long time to to download EditLogs?
- Is the NameNode too slow in uploading/downloading FsImages from the Secondary NameNode?
- Did jobs in a queue fail? If so, which queue contained failed jobs?
- Does any queue contain jobs that have been running for over 24 hours? If so, which queue is it?
- Did logins to the NameNode fail often?
- Did login authentication take too long?
- Did any MapReduce job fail? If so, which user initiated this job?
- Did any user's MapReduce jobs encounter errors? If so, which user's jobs threw errors?
- Which user's MapReduce jobs took too long for execution? Where did the jobs spend maximum time - in running map tasks? or in running reduce tasks?
- Which user's jobs spilled the maximum number of records to disk? Which jobs are these?
- Are Journal transactions taking too long to execute?
- Are Standby nodes too slow in reading edits from JournalNode machines and synchronizing with the Active node?
- Is the Retry cache used optimally?
- Are RPC requests in queue for a long time? If so, via which RPC interface were such requests received?
- Which RPC interface is experiencing latencies when processing RPC requests?
- Via which RPC interface did the maximum number of authentication failures occur?
- Are there any unhealthy nodes in the cluster? If so, which ones are they?
- Are any nodes in the cluster lost - i.e., has any node not sent heartbeats to the RM beyond a configured period of time?
- Are all nodes in the cluster communicating their health status to the RM? Is there any node that is not doing so?
- Have containers failed on any node? If so, which node is it?
- Is any node in the cluster take a long time to launch containers?
- Were bad local directories and/or bad log directories observed on any node?
- Did any unscheduled reboots of the NodeManager and/or ResourceManager occur recently?
- Is the cluster running out of storage space? If so, what is contributing to the storage contention - is it because too much space is used up for non-DFS purposes? is it because the cache is over-sized? is it owing to multiple stale nodes in the cluster?
- Are any threads waiting to acquire the FSNameSystem lock?
- Is the shuffling process error-free? If not, what type of errors are impeding this process?
The Hadoop Resource Manager Layer