Administering the eG Manager to Display Information on SNMP Traps
To achieve this, do the following:
- Login to eG administrative interface as admin. To display trap messages, eG uses two tests, namely, Network Traps test and Application Traps test. While the Application Traps test is associated with the Application Processes layer, the Network Traps test is associated with the Network layer. The Network Traps test is an external test that reports the count of SNMP trap messages received from network devices. The Application Traps test, also executed by an external agent, reports the number of SNMP trap messages sent by applications. These tests have been mapped to the Network node and Cisco router components. Therefore, to configure these tests, first manage a component of type Network Node or Cisco Router.
- Then, open the enable / disable tests page using the menu sequence: Agents -> Tests -> Enable / Disable menu sequence. Select the component type to which the tests have been associated from the list box therein, pick Performance as test type, pick the Network Traps test from the disabled tests list, click the >> button to move it to the enabled tests list, and finally click on the Update button to save the changes.
-
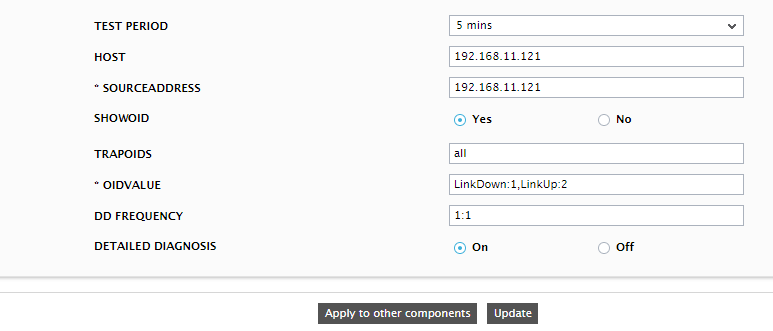
Then, proceed to configure the test for a specific component by navigating to the specific configuration page (Agents -> Tests -> Specific Configuration). Doing so will open Figure 1 using which the test can be configured.
-
In Figure 1, specify the following:
- Test period - How often should the test be executed
- Host - The host for which the test is to be configured
- sourceaddress - Specify a comma-separated list of IP addresses or address patterns of the hosts from which traps are considered in this test. For example, 10.0.0.1,192.168.10.*. A leading ‘*’ signifies any number of leading characters, while a trailing ‘*’ signifies any number of trailing characters.
-
oidvalue - Provide a comma-separated list of OID and value pairs returned by the traps. The values are to be expressed in the form, DisplayName:OID-OIDValue. For example, assume that the following OIDs are to be considered by this test: .1.3.6.1.4.1.9156.1.1.2 and .1.3.6.1.4.1.9156.1.1.3. The values of these OIDs are as given hereunder:
OID
Value
.1.3.6.1.4.1.9156.1.1.2
Host_system
.1.3.6.1.4.1.9156.1.1.3
NETWORK
In this case the oidvalue parameter can be configured as Trap1:.1.3.6.1.4.1.9156.1.1.2-Host_system, Trap2:.1.3.6.1.4.1.9156.1.1.3-Network, where Trap1 and Trap2 are the display names that appear as descriptors of this test in the monitor interface.
An * can be used in the OID/value patterns to denote any number of leading or trailing characters (as the case may be). For example, to monitor all the OIDs that return values which begin with the letter ‘F’, set this parameter to Failed:*-F*.
Typically, if a valid value is specified for an OID in the OID-value pair configured, then the test considers the configured OID for monitoring only when the actual value of the OID matches with its configured value. For instance, in the example above, if the value of OID .1.3.6.1.4.1.9156.1.1.2 is found to be HOST and not Host_system, then the test ignores OID .1.3.6.1.4.1.9156.1.1.2 while monitoring. In some cases however, an OID might not be associated with a separate value – instead, the OID itself might represent a value. While configuring such OIDs for monitoring, your oidvalue specification should be: DisplayName:OID-any. For instance, to ensure that the test monitors the OID .1.3.6.1.4.1.9156.1.1.5, which in itself, say represents a failure condition, then your specification would be:
Trap5: .1.3.6.1.4.1.9156.1.1.5-any.
- showoid – Specifying true against SHOWOID will ensure that the detailed diagnosis of this test shows the OID strings along with their corresponding values. If you enter false, then the values alone will appear in the detailed diagnosis page, and not the OIDs.
- trapoids – By default, this parameter is set to all, indicating that the eG agent considers all the traps received from the specified source addresses. To make sure that the agent considers only specific traps received from the sourceaddress, then provide a comma-separated list of OIDs in the trapoids text box. A series of OID patterns can also be specified here, so that the test considers only those OIDs that match the specified pattern(s). For instance, 94.2,*.1.3.6.1.4.25*, where * indicates leading and/or trailing spaces.
- DD Frequency - Refers to the frequency with which detailed diagnosis measures are to be generated for this test. The default is 1:1. This indicates that, by default, detailed measures will be generated every time this test runs, and also every time the test detects a problem. You can modify this frequency, if you so desire. Also, if you intend to disable the detailed diagnosis capability for this test, you can do so by specifying none against DD frequency.
-
DETAILED DIAGNOSIS - To make diagnosis more efficient and accurate, the eG Enterprise embeds an optional detailed diagnostic capability. With this capability, the eG agents can be configured to run detailed, more elaborate tests as and when specific problems are detected. To enable the detailed diagnosis capability of this test for a particular server, choose the On option. To disable the capability, click on the Off option. The option to selectively enable/disable the detailed diagnosis capability will be available only if the following conditions are fulfilled:
- The eG manager license should allow the detailed diagnosis capability
- Both the normal and abnormal frequencies configured for the detailed diagnosis measures should not be 0.
- Finally, click the update button in Figure 1.
- Similarly, the Application Traps test can also be configured. Then, signout of the administrative interface.