Monitoring the Hitachi AMS Storage Device
The Hitachi AMS SAN monitoring model provided by eG Enterprise monitors the I/O activity and disk usage on the storage device at frequent intervals, and proactively alerts administrators to abnormalities (if any), so that performance issues are rapidly identified and resolved, and the business-critical application the device supports function without a glitch.

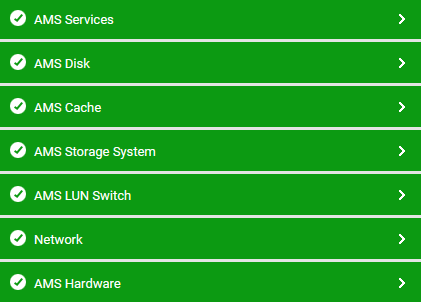
Figure 1 : The layer model of an Hitachi AMS device
The metrics so collected and reported by the eG agent enable administrators to find quick and accurate answers to the following performance queries:
- Are any drives operating very slowly? Which ones are these?
- Is I/O load to the drives uniformly balanced? Has any drive been over-utilized?
- Are any port types disabled on the device? Which ones are these?
- Is any port over-loaded?
- Are any processors over-utilized? Which ones are these?
- Are the caches healthy? Is data been written to the caches at a steady rate, or are too many writes still pending? Which queue is over-loaded with pending requests to cache -is it the clean queue, middle queue, or the physical queue?
- Is there too much I/O activity on any LUN on the device? Is enough data been written to the LUNS, or does any LUN have a very low write hit ratio?
- How is I/O load distributed across all the RAID groups on the device? Is any group overloaded?
- Is heavy data traffic flowing through any backend loop? Which one is it?
- What is the current status of the critical hardware components of the storage device, such as, the battery, the enclosure controller, the disk, the fan, the tray, the power supply point, and the cache memory?