Agent based monitoring of the IIB server
Let us now discuss on the steps for creating a JMS Administered Object automatically and manually in detail in the forthcoming sections.
Automatically creating a JMS Administered Object using scripts
Follow the steps mentioned below to automatically create a JMS Administered Object:
-
By default, the following files will be available in the <EG_INSTALL_DIR>\lib folder say for e.g., C:\egurkha\lib of the target environment:
- eGJMSIIBCreateConfig.bat
- eGJMSIIBCreateConfig.sh
-
If IIB server is installed on a Windows environment, execute the eGJMSIIBCreateConfig.bat file from the command prompt of the IIB server host as follows:
C:\egurkha\lib>eGJMSIIBCreateConfig.bat
Then proceed to step 5.
-
If IIB server is installed on a Linux environment, execute the eGJMSIIBCreateConfig.sh file from the shell script.
/opt/egurkha/lib>eGJMSIIBCreateConfig.sh
-
Now, specify the exact location on which the MQ Java installation directory is installed. In our example, the installation path is /opt/mqm.
Please enter the MQ java installed path: /opt/mqm
-
Once the respective files for the Windows and Linux environments are executed successfully, you will be asked to provide the input parameters that are required for creating the JMS Administered Object. To begin with, specify the location of the JNDI namespace as mentioned below:
Where is the JNDI namespace located?
1. File System
2. LDAP Server
Enter your choice [1]: 1
-
Selecting the File System option indicates that the JNDI namespace is located on the IIB server host itself. Once you have chosen the File System option, you will be required to provide the IP address of the IIB server host.
Enter the host IP address on which the IBM Integration Bus is installed: 192.168.9.165
-
To create the Connection Factories and the Destinations, specify the name of the queue manager.
Enter the name of the QManager: IB9QMGR
-
Now, specify the name of the node in the IIB server host that is to be monitored as shown below:
Enter the name of the Integration node: IB9NODE
-
Finally, specifying the port on which the queue manager listens will automatically create the JMS Administered Object along with the Connection Factories and the Destinations.
Enter the port on which the QManager listens: 2414
-
If all the input parameters are successfully validated in the target Windows environment, then the following details will appear:
****************************************************************************
Following are the parameters that need to be provided while configuring the tests:
HOST = 192.168.9.165
QMANAGER NAME = IB9QMGR
QMANAGER PORT = 2414
INTEGRATION NODE NAME = IB9NODE
JNDI NAMESPACE LOCATION = File
SSL = No
USERDN ==> none
JNDI PROVIDER URL ==> file:///C:/eGurkha/lib/IIB
TOPICCONNECTIONFACTORY = eG_TCF_192.168.9.165_2414
JMS RESOURCE STATS = eG_Res_Topic_192.168.9.165_2414
JMS FLOW STATS = eG_Msg_Topic_192.168.9.165_2414
****************************************************************************
Note:
If you fail to notice the details mentioned in Step 10 and Step 11, then you can figure them out in the <EG_INSTALL_DIR>\lib\IIB\eG_IIB_test_config.log file. If multiple IIB nodes are monitored in the target environment, then the test parameter values will be stored for each IIB node separately.
Manually creating a JMS Administered Object in the IIB server using MQ Explorer console/GUI
Prior to creating a JMS Administered Object, do the following:
- Login to the IIB server host.
- In the location of your choice, say for e.g., C:\, create a new empty folder. In our example, the name of the folder is JNDI-Directory. This folder, otherwise called the JNDI namespace is used to store the contents of the JMS Administered Object that you are about to create.
Follow the steps mentioned below to create a JMS Administered Object:
-
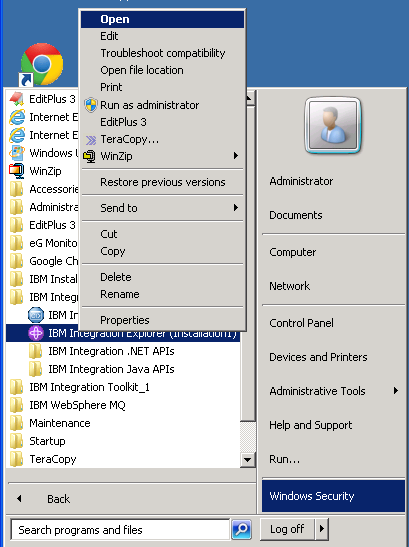
From the IIB server host, follow the menu sequence: Start -> All Programs -> IBM Integration Bus 9.0 -> IBM Integration Explorer (see Figure 1).
-
Open the IBM Integration Explorer as shown in Figure 1. Figure 2 will then appear.]
-
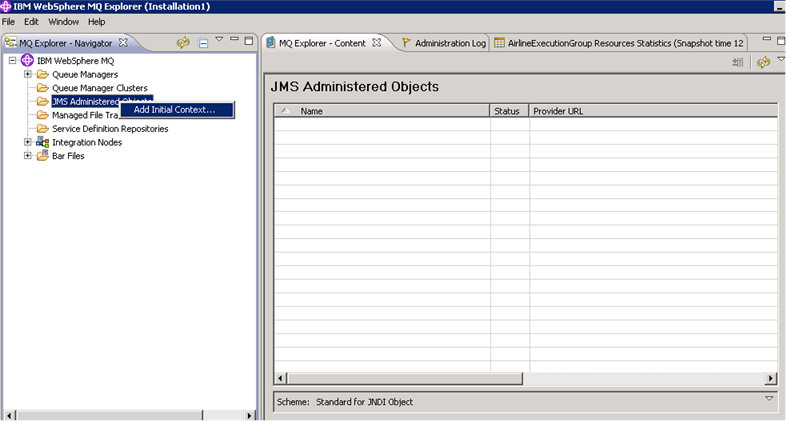
Right clicking the JMS Administered Objects node from the MQ Explorer – Navigator panel will display the Add Initial Context option (see Figure 2). An initial context is the root of the JNDI namespace that is used to access the JMS objects that are stored in them.
-
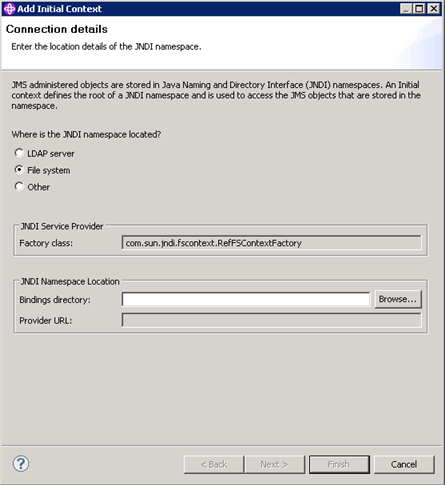
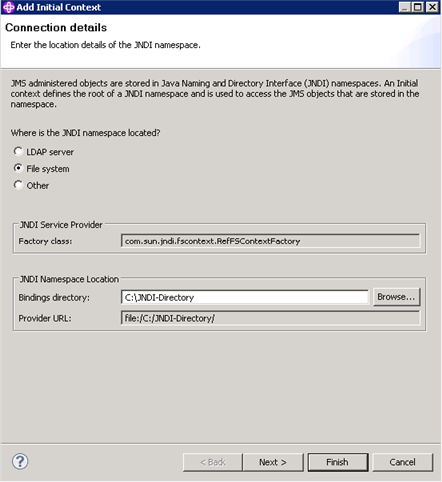
In Figure 3 that appears, you will be required to provide the location of the JNDI namespace that you have created for storing the JMS Administered Object. If you have created the JNDI namespace in the IIB server host itself, then set the Where is the JNDI namespace located? to File system. If JNDI namespace is not created in the IIB server host, then select the LDAP server option.
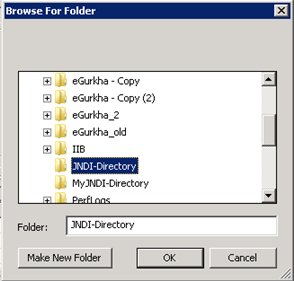
Figure 4 : Selecting the exact path to the created JNDI namespace
-
Select the exact path to the JNDI namespace (see Figure 4) that you have created by clicking the Browse button in Figure 5. This will automatically populate the Bindings directory and the Provider URL text boxes (see Figure 5).
-
Clicking the Next button in Figure 5 will navigate you to Figure 5. Provide a name of your choice in the Context nickname text box.
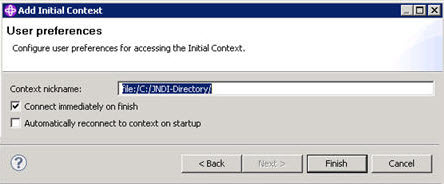
Figure 6 : Providing a nickname for the JMS Administered Object to be created
-
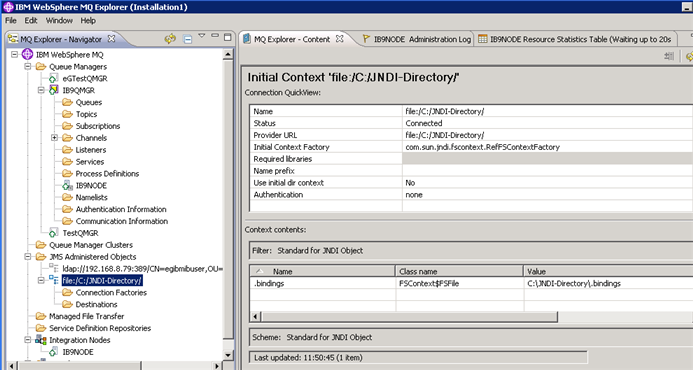
Clicking the Finish button in Figure 6 will complete the initial context specification. The nickname specified in Figure 6 will be displayed as the name of the JMS Administered object in the MQ Explorer – Navigator section. In our example, the nickname is not specified and the Provider URL is automatically displayed as the JMS Administered Object with two default folders named Connection Factories and Destinations (see Figure 7).
Now let us discuss the steps that need to be followed for creating a connection factory and the destinations in the following sections.
Creating a Connection Factory
For an eG agent to connect to the IIB and collect the desired metrics, a connection needs to be established between the eG agent and the Queue manager of the IIB that is to be monitored. To establish such a connection, you would be required to create a connection factory. Follow the below mentioned steps to create a connection factory:
-
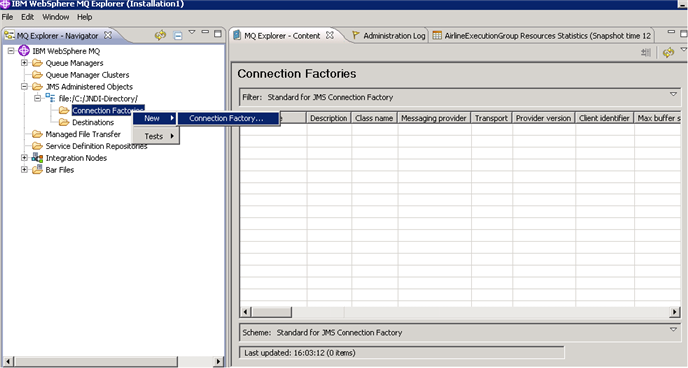
Right click the Connection Factories folder of Figure 7 and follow the menu sequence: New -> Connection Factory (see Figure 8).
-
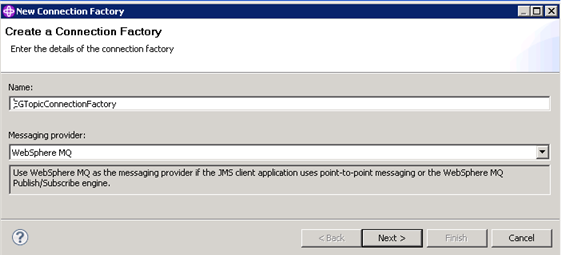
In Figure 8 that appears, specify the Name of the connection factory. In our example, the name of the connection factory is EgTopicConnectionFactory.
-
By default, the messages from the IIB are published on the WebSphere MQ. The eG agent is required to subscribe to the messages in order to monitor the IIB. Select WebSphere MQ as the Messaging provider so that the eG agent can communicate with the WebSphere MQ to collect the required metrics while monitoring the IIB.
-
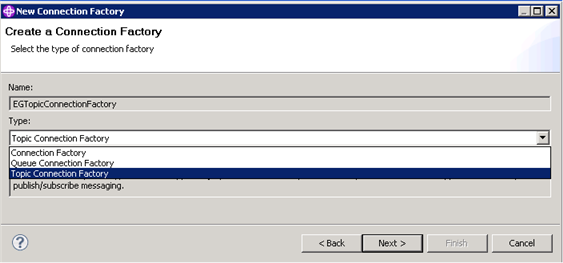
Clicking the Next button in Figure 9 will enable you to select the Type of the connection factory. Since the eG agent subscribes to the published messages to collect the metrics, select Topic Connection Factory option as the Type. Clicking the Next button will navigate you to Figure 10.
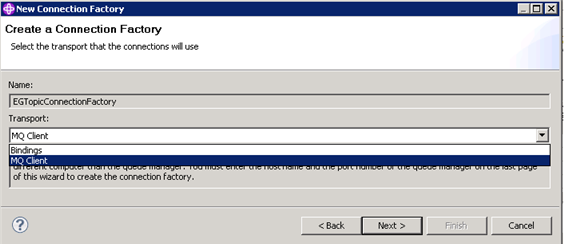
Figure 11 : Selecting the transport type of the connection factory
- Select MQ client as the Transport type from Figure 11 and click the Next button.
-
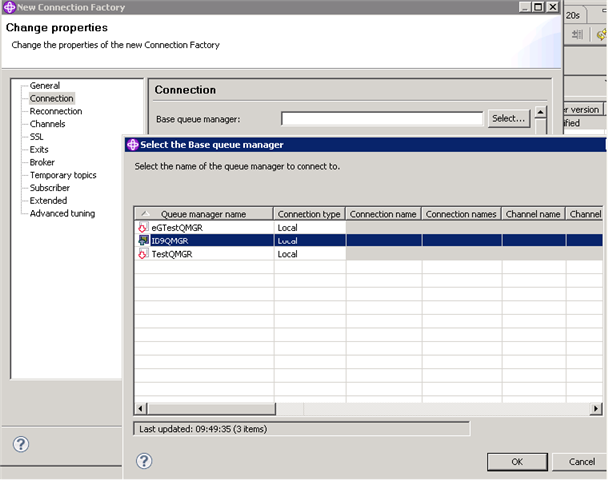
The Change Properties page will then appear displaying the general settings of the connection factory. Click the Connection option in the left panel to select the base queue manager of the IIB node that is to be monitored (see Figure 12). Clicking the Select… button will list out all the available Queue managers in the Select the Base Queue manager pop up window. Select the queue manager of your choice and click the OK button in Figure 12.
-
In the Connection list of Figure 12, specify the host name i.e., the IP address of the chosen queue manager and the port on which the queue manager listens in the following format: IP address(Port).
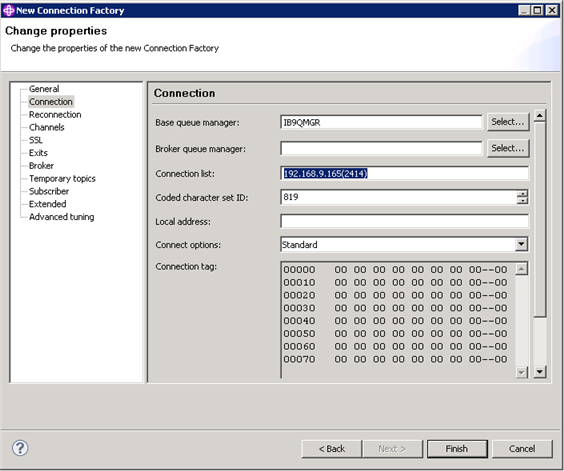
Figure 13 : Specifying the host name and port number of the chosen queue manager
-
If you have chosen to use a custom server connection channel for monitoring by the eG Enterprise, then you may be required to select the server connection channel of your choice from the Channels option of the Change Properties page. The default server connection channel will be listed in the Channel text box as shown in Figure 14.
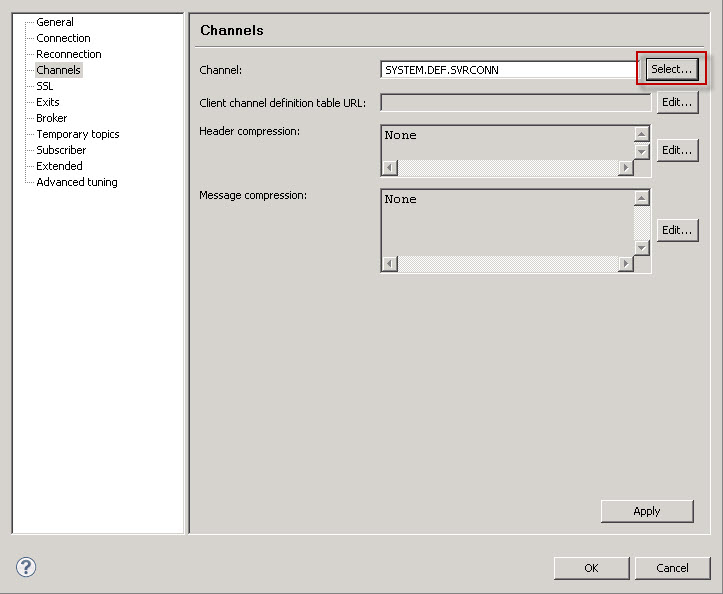
-
Clicking the Select button against the Channel text box in Figure 14 will lead you to Figure 15 where you will be required to choose the server connection channel that you have created for monitoring purpose by the eG Enterprise.
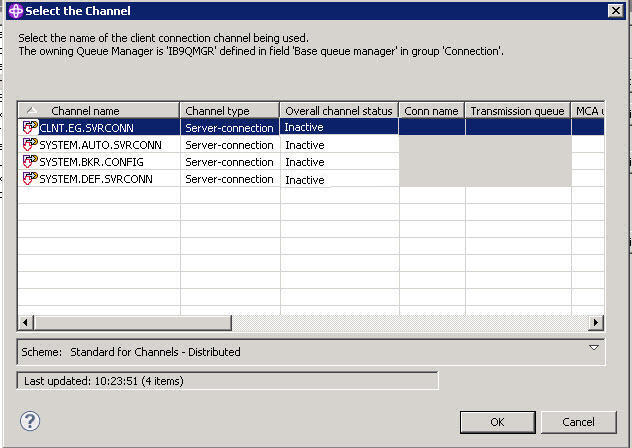
Figure 15 : Selecting a server connection channel of your choice
-
Clicking the OK button in Figure 15 will populate the Channel text box of Figure 14 with the chosen server connection channel as shown in Figure 16.
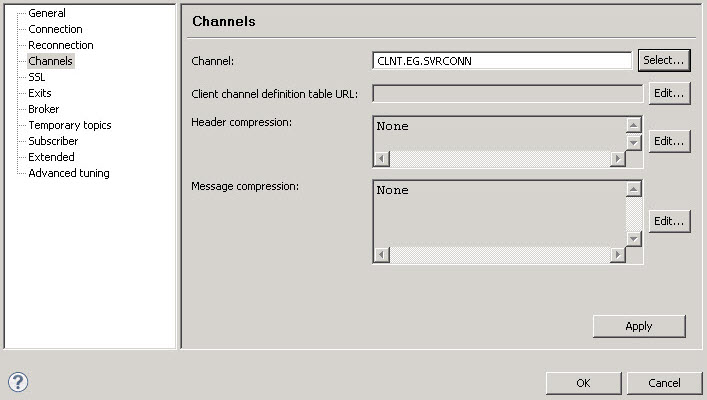
- Clicking the Apply button in Figure 16 will let the chosen server connection channel to communicate with the eG agent to collect the required metrics from the target server.
-
To identify the port at which the queue manager is listening, select the Listeners node available below the IIB node that is to be monitored in the MQ Explorer – Navigator panel (see Figure 17). The port number will be displayed in the Listeners panel as shown in Figure 17.
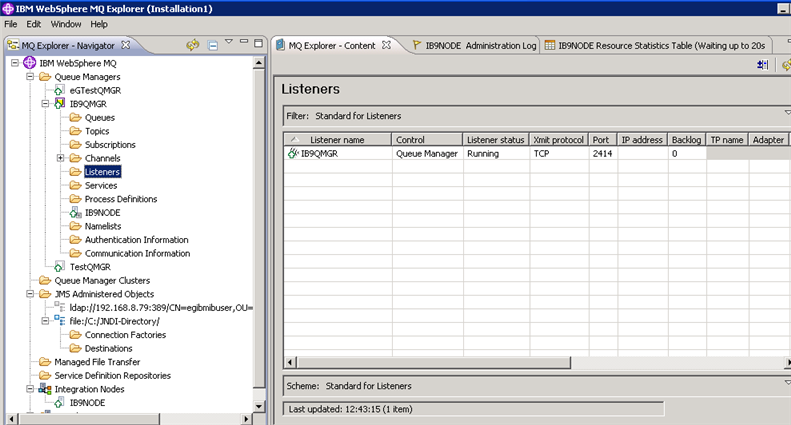
Figure 17 : Identifying the port number of the chosen queue manager
- Clicking the Finish button in Figure 17 will create the connection factory successfully.
Creating the JMS Destinations
By default, the eG agent collects the metrics from the IIB by subscribing to the default topics that are available in the IIB. To store the messages retrieved from the subscribed topics, two new destinations need to be created. Follow the steps below to create the destinations:
-
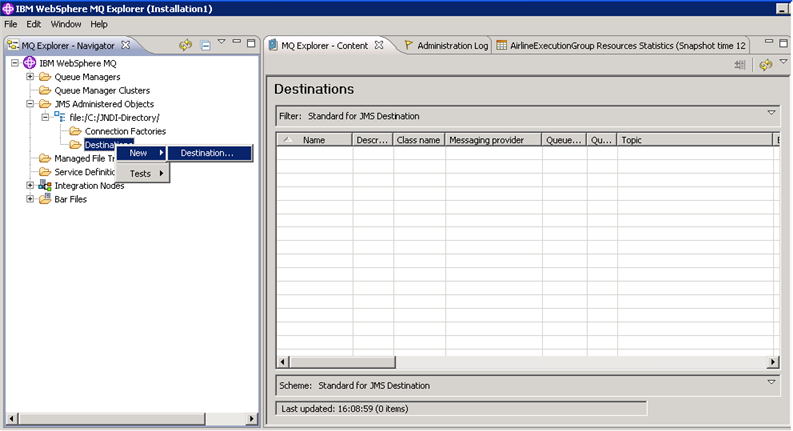
Right click the Destinations folder of Figure 7 and follow the menu sequence: New -> Destination (see Figure 18).
-
In Figure 19 that appears, enter the Name of the destination that you wish to create. Choose the destination Type i.e., the Topic that you wish to subscribe.
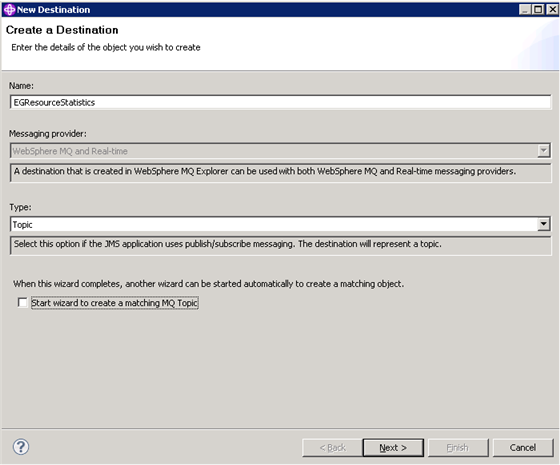
-
Clicking on the Next button in Figure 19 will lead you to the Change properties page as shown in Figure 20.

Figure 20 : Providing the Topic for storing the resource statistics
-
By default, message flow statistics are stored in one destination and the resource statistics are stored in another destination. To create a destination to store the resource statistics, provide the following string in the Topic text box of Figure 20.
$SYS/Broker/<Name of the IIB node>/ResourceStatistics/#
In our example, the string will be as follows:
$SYS/Broker/IB9NODE/ResourceStatistics/#
- Clicking the Finish button in Figure 20 will create the desired JMS destination.
-
In order to create a new destination named EGStatisticsAccounting, follow the steps 1-3 mentioned above. In the Change properties page as shown in Figure 21, provide the following string in the Topic text box.
$SYS/Broker/<name of the IIB node>/StatisticsAccounting/#
In our example, the string will be
$SYS/broker/IB9NODE/StatisticsAccounting/#
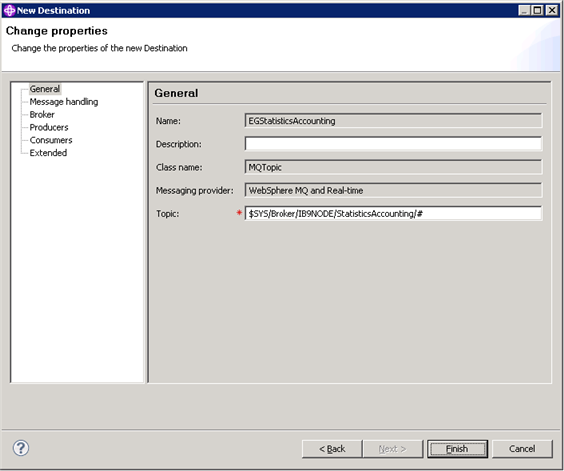
Figure 21 : Providing the Topic for collecting the message flow statistics
- Clicking the Finish button in Figure 21 will create the JMS destination successfully.