Monitoring the IBM Integration Bus
eG Enterprise provides a specialized IBM Integration Bus monitoring model (see the below figure), which periodically collects measures from various components of the IBM Integration Bus and notifies administrators of potential performance issues and processing slowdowns experienced on the whole by the IBM Integration Bus server.
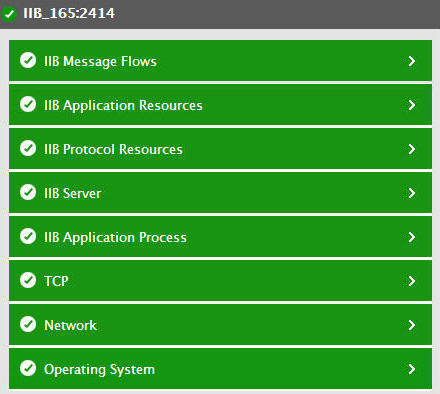
Figure 1 : The layer model of the IBM Integration Bus
Using the metrics reported , administrators can find quick and accurate answers for the following performance questions:
- How many requests to the FTP server were successful and how many requests failed?
- How many connections are currently available in the JBDC connection pool and how many connections are utilized?
- How many JDBC connections timed out?
- How many times the statements were executed successfully for each ODBC DSN and how many actually failed?
- How many connections were error prone for each ODBC DSN?
- What is the throughput of the messages through the SOAP service?
- How many faulty replies were sent through the SOAP service?
- Is there a resource contention on the firewall device? Which resource is bottlenecked – CPU or memory?
- How many connections can the firewall service? Is the number of connections currently handled by the firewall unusually high?
- How many connections were open on each TCP client node and TCP server node?
- How well data and messages were transmitted/received on each TCP client node and TCP server node?
- How many requests to the CICS Transaction server were successful and how many actually failed?
- How many decisions were processed successfully and how many decisions failed for each Decision service?
- How well the garbage collection activity is performed on the heap?
- How well the global cache processes the requests and how well the global cache is utilized?
- How well each parser type processing the requests?
- How long does the message flow node take to process the input messages?
- How many messages are processed by each message flow node and what is the maximum time taken to process an input message?
- How long does a message flow take to process the input messages?
- How many messages are processed by each message flow and the maximum time taken to process an input message?
- How well each thread in the execution group processes the input messages and how long does it take to process the input messages?
- What is the processing rate of the messages for each thread?
The tests pertaining to the IIB Application Process layer is similar to that of the Application Process layer which is already dealt in the Monitoring Unix and Windows Servers document and the tests pertaining to the Operating System, TCP and Network layer have also been dealt with in the Monitoring Unix and Windows Servers document, The IIB Server Layer