Enabling Performance Monitoring
To enable performance monitoring for the WebSphere server 6.0 (or above), do the following:
- Open WebSphere’s admin console as explained in steps 1-3 of Configuring a WebSphere Application Server 6.x to Work with the eG Agent.
-
In the screen that appears (see Figure 1), expand the Monitoring and Tuning node in the left pane, and click on the Performance Monitoring Infrastructure (PMI) option within.
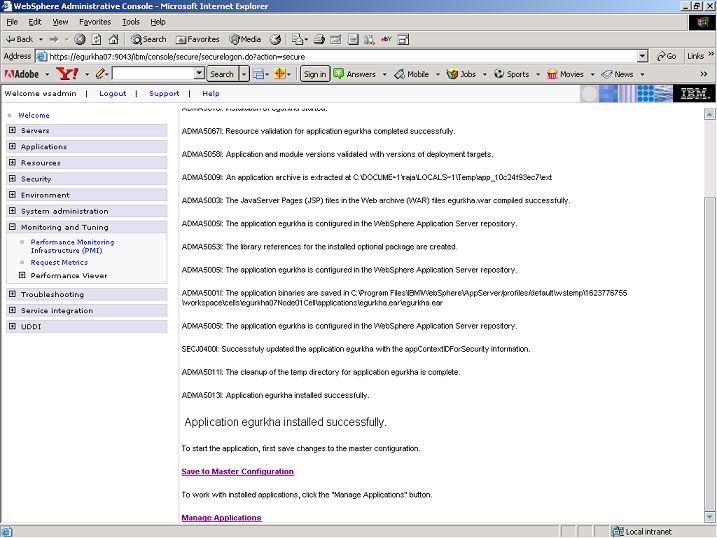
Figure 1 : Selecting the 'Performance Monitoring Infrastructure (PMI)' option
-
As you can see, the right pane of Figure 2 displays the list of existing application servers. Now, click on the server that has been configured for monitoring by eG as indicated by Figure 2.
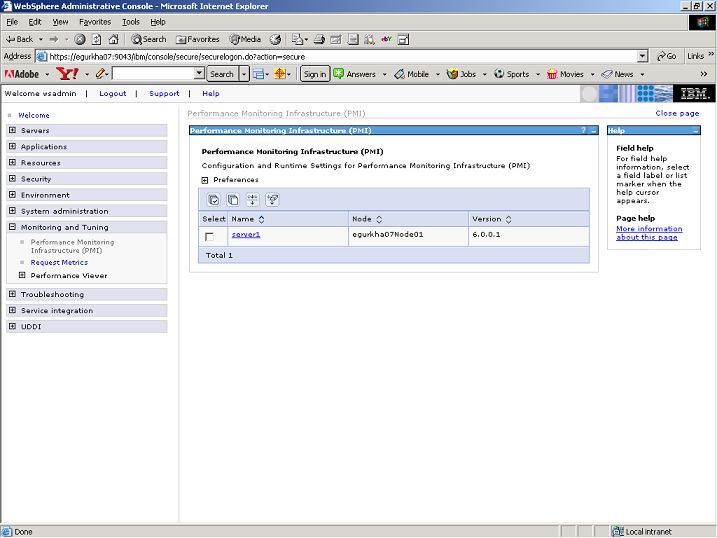
Figure 2 : Clicking on the server that has been configured for monitoring by eG
-
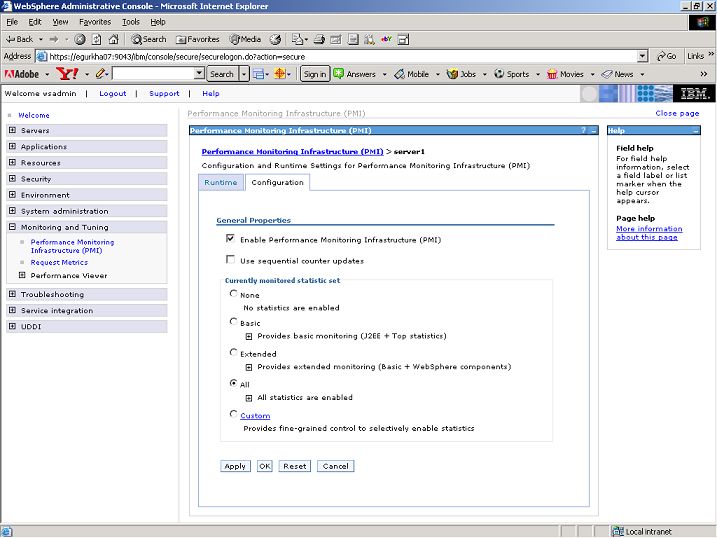
In Figure 3 that appears, select the Enable Performance Monitoring Infrastructure (PMI) option, and then click the Apply and ok buttons to register the changes.
- Finally, restart the WebSphere server. For that, first stop the server using the command ./stopServer.sh <servername>, and then, start it using the command ./startServer.sh <servername>. Both these commands are available in the <WAS_HOME>/bin directory, where <WAS_HOME> is the install directory of the WebSphere server.