Managing the IBM WebSphere Application – 4/5.x Server
After installation of the eG Agent, please follow the following steps to configure eG to monitor WebSphere Application from the eG Manager.
- Login to the eG administrative interface as admin.
- Check if the WebSphere application server is already discovered. If already discovered, use the COMPONENTS - MANAGE/UNMANAGE page that appears on using the Infrastructure -> Components-> Manage/Unmanage menu to manage it. Otherwise, change the port information if needed and run discovery to discover it or manually add the WebSphere Server. For adding, use the COMPONENTS page that can be accessed through the menu sequence Infrastructure -> Components -> Add/Modify. While components manually added are automatically managed, proceed to manually manage the discovered components using the COMPONENTS - MANAGE/UNMANAGE page.
-
Now, if you proceed to log out of the administrative interface, a list of unconfigured tests (see Figure 1) will appear prompting you to configure tests for the WebSphere Server.
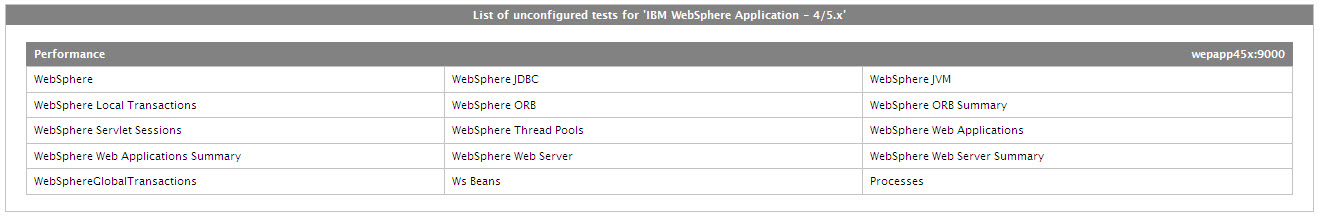
Figure 1 : A page displaying WebSphere tests to be configured
-
Click on, say, Ws Beans test to move to the page that facilitates test configuration (see Figure 2). This test reports the performance metrics that determines the functioning of the EJB groups.
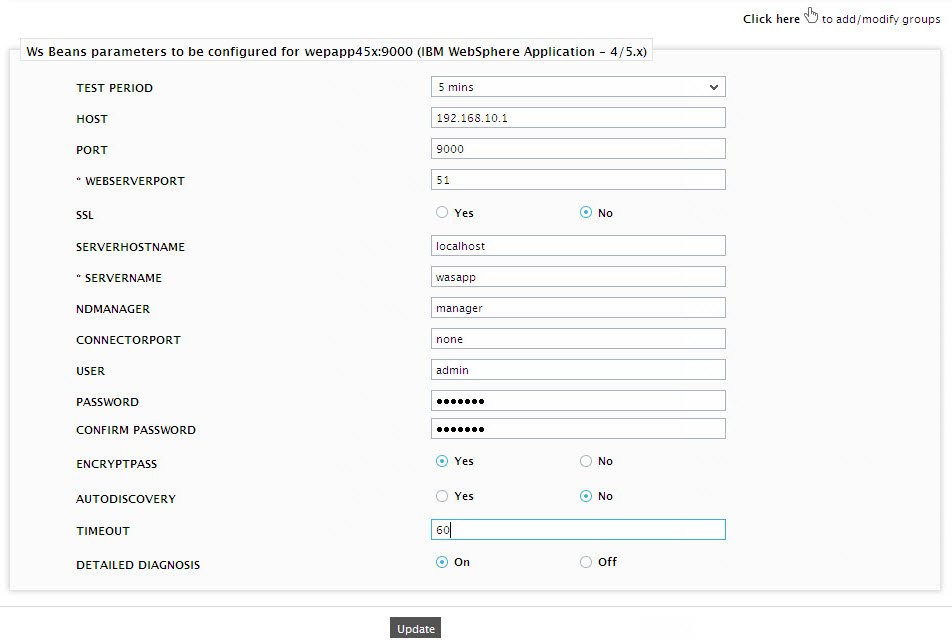
Figure 2 : Specifying the test parameters for a WebSphere application
-
Here, select the WebSphere server for which the test is to be configured, click on the Configure button, and provide the following information:
- Test period - how often should the test be executed
- Host – The IP address of the WebSphere application server
- Port – The port number of the WebSphere application server
- WebServerPort – The port number through which the WebSphere applications can be accessed. (For IBMHTTPServer this information can be found in the httpd.conf file located in $<INSTALLDIR>/conf directory.)
- ssl - Indicate whether the SSL (Secured Socket Layer) is to be used to connect to the WebSphere server.
-
serverhostname - Specify the node name of the server instance being monitored. To know the node name that is to be specified against the serverhostname parameter, do the following:
- Login to the WebSphere Administrative Console.
-
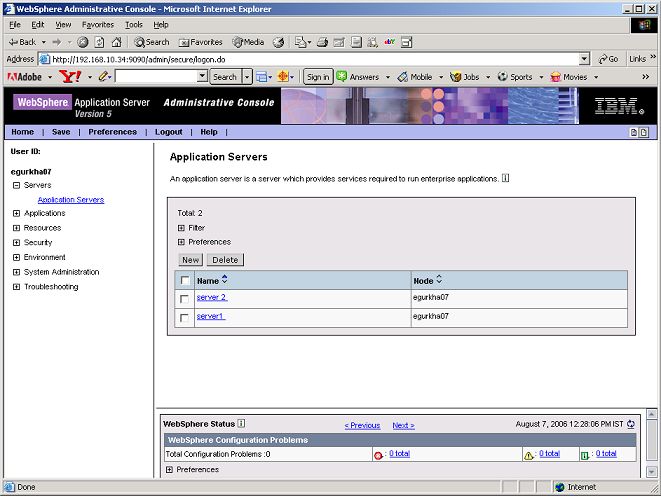
Expand the Servers node in the tree structure in the left pane of the console, and click on the Application Servers link within (see Figure 3).
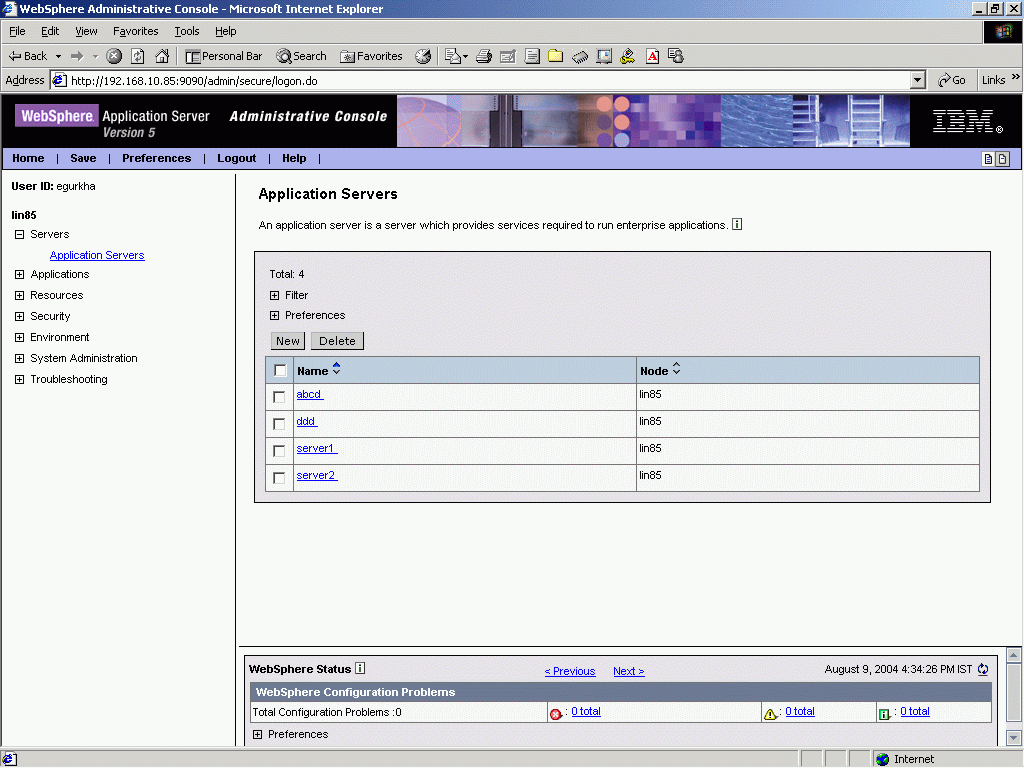
Figure 3 : The WebSphere Administrative Console displaying the list of application server instances
- A list of application server instances and their corresponding node names will then appear in the right pane of the console. From this list, you can figure out the node name that corresponds to the application server instance being monitored, and specify that name against the SERVERHOSTNAME parameter.
-
servername – Specify the name of the WebSphere server instance to be monitored. To know the instances of a WebSphere server currently available, do the following:
- Connect to the WebSphere Administrative console using the URL: http://<WebSphereIP>:<WebSpherePort>/, of the WebSphere server:Port number of the WebSphere server>\admin.
-
Then, login to the administrative console and expand the Servers node in the left pane of the console. Next, click on the Application Servers sub-node under the Servers node (see Figure 4).
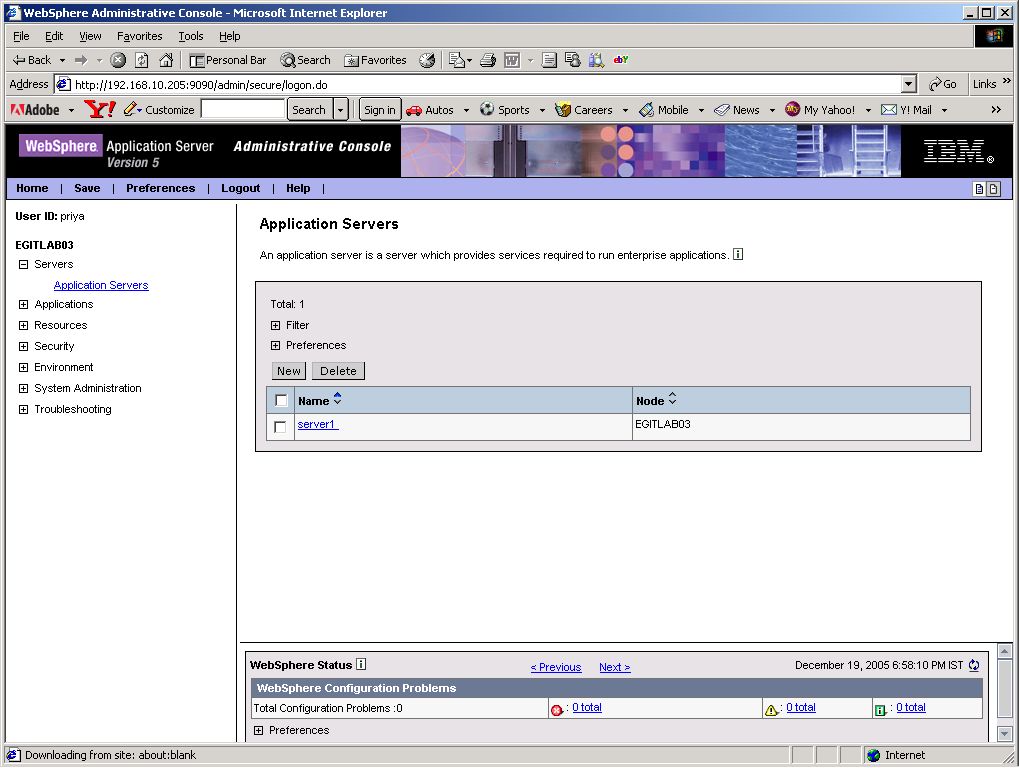
- A list of server instance Names and their corresponding Node values will then be displayed in the right pane (see Figure 4).
- One of the displayed server instances can be specified as the value of the servername parameter.
-
ndmanager - The ndmanager parameter is applicable only under the following circumstances:
- If the WebSphere server being monitored belongs to a cluster, or,
- If the WebSphere server being monitored is one of many instances of the server running on the same host
In the case of situation (a), in the ndmanager text box, provide the host name of the node manager that manages the application servers in the cluster. To know the name of the node manager, do the following:
- Login to the Administrative Console of the node manager using the URL http://<WebSphereIP>:<WebSpherePort>.
-
Using the tree-structure in the left pane of the Administrative Console that appears (see Figure 5), drill down to the Deployment Manager node within System Administration.
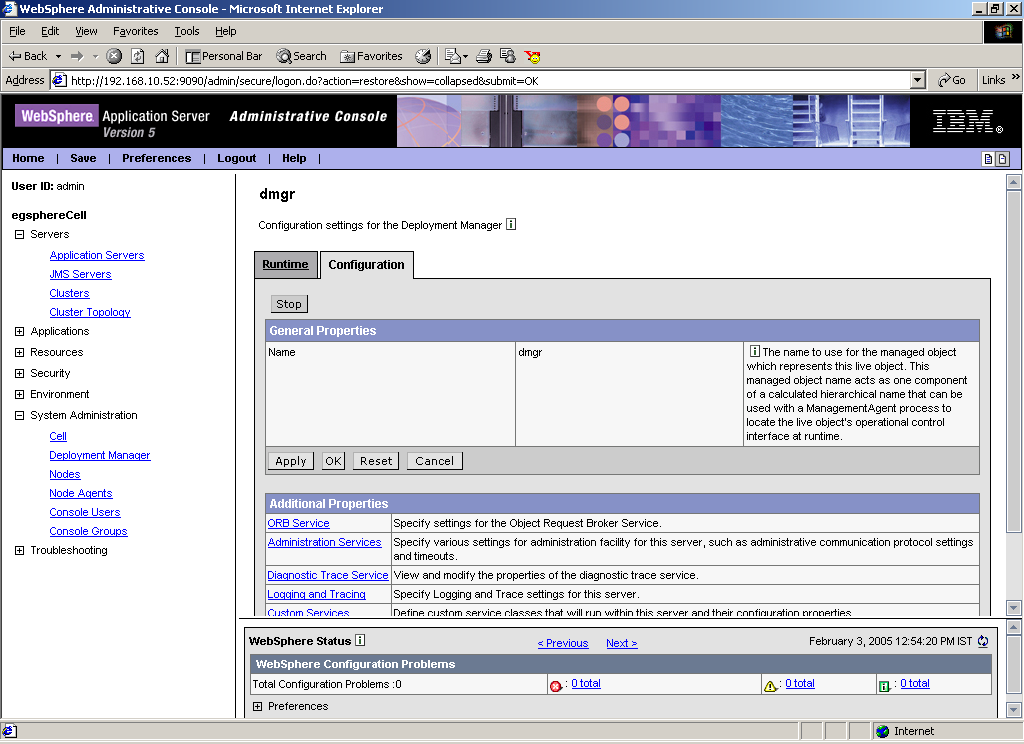
- Select the Configuration tab that appears in the right pane (see Figure 5), and scroll down to the End Points link in the Additional Properties section.
- Once you locate the End Points link, click on it.
-
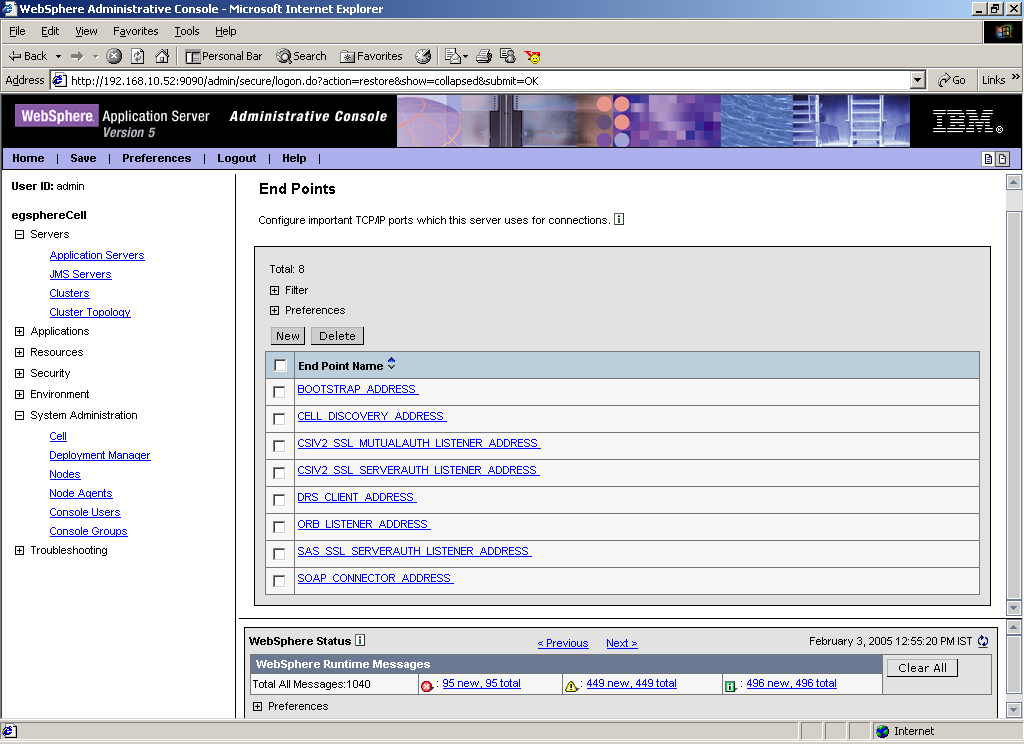
Figure 6 will then appear. Here, select the SOAP_CONNECTOR_ADDRESS link.
-
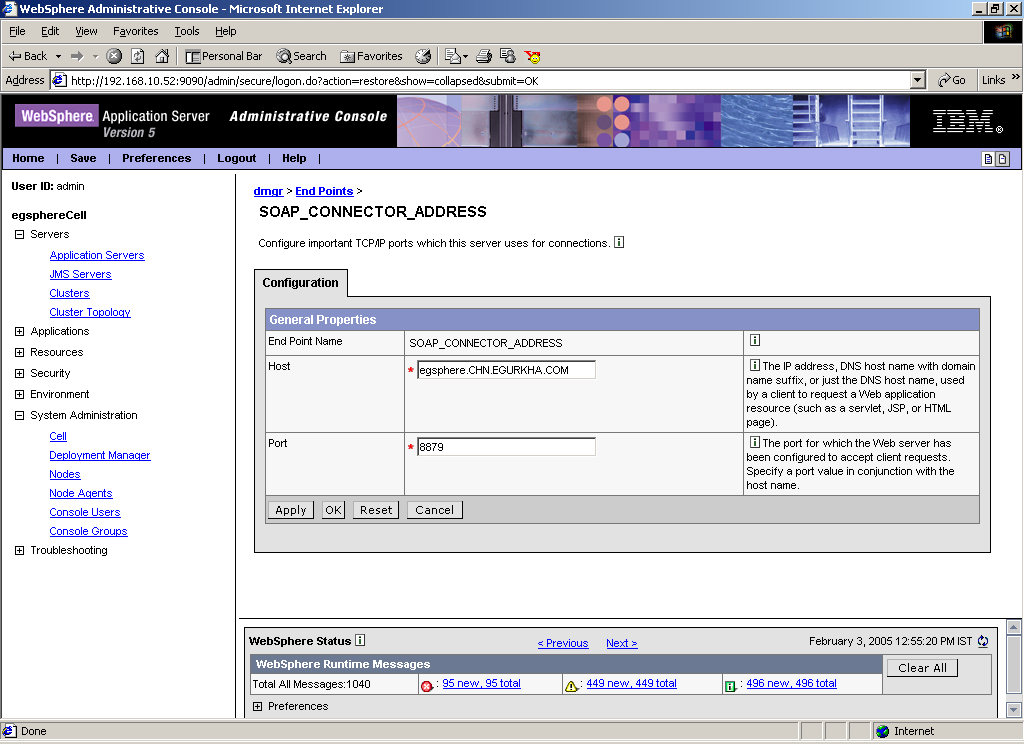
The fully qualified domain name displayed against Host in Figure 7 should be specified as the host name of the NODE MANAGER in the ndmanager text box of Figure 2.
In the case of situation (b), enter the SERVERHOSTNAME itself as the NDMANAGER.
If both conditions (a) and (b) do not apply, then specify none here.
-
connectorport – The connectorport parameter is applicable only under the following circumstances:
- If the WebSphere server being monitored belongs to a cluster, or,
-
If the WebSphere server being monitored is one of many instances of the server running on the same host
In case of situation (a), the connectorport parameter will take the port number using which the node manager communicates with the WebSphere servers in the cluster. The connector port can be a SOAP port or an RMI port. To know the port number, do the following:
-
From the Node manager’s host, open the <WEBSPHERE_INSTALL_DIR>\DeploymentManager\properties\wsadmin.properties file (see Figure 8).
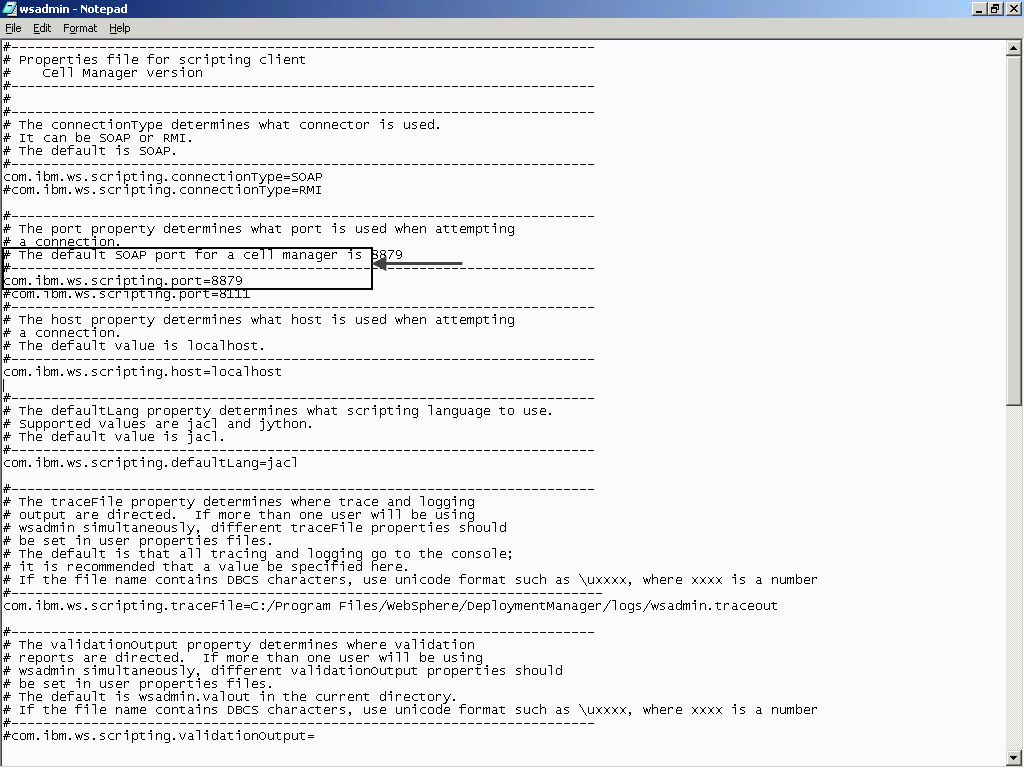
- Figure 8 highlights two port-related entries in the file – one commented (using a #) and one uncommented. The uncommented entry denotes the active port, and its corresponding value (8879 in the example illustrated by Figure 8) will have to specified as the connectorport in Figure 2.
-
In case of situation (b), do the following to know the connectorport.
- Login to the WebSphere Administrative Console.
-
Expand the Servers node in the tree-structure in the left pane of the console, and click on the Application Servers link. A list of application server instances will then appear in the right pane (see Figure 9).
-
Click on the server instance being monitored. Doing so invokes Figure 10 that displays the Configuration of the chosen server instance.
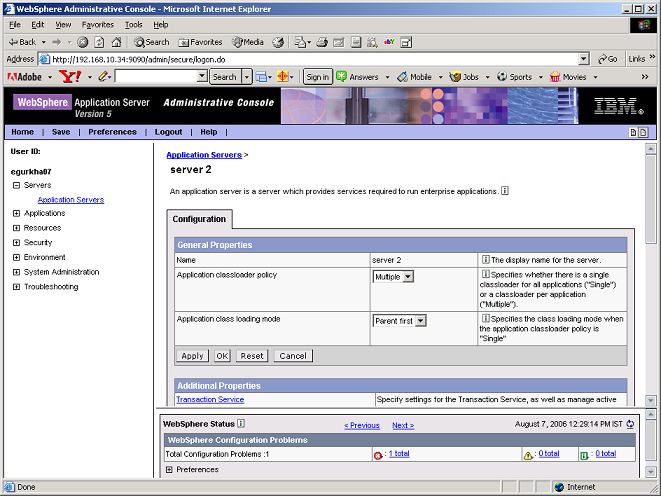
Figure 10 : The Configuration of the server instance being monitored
-
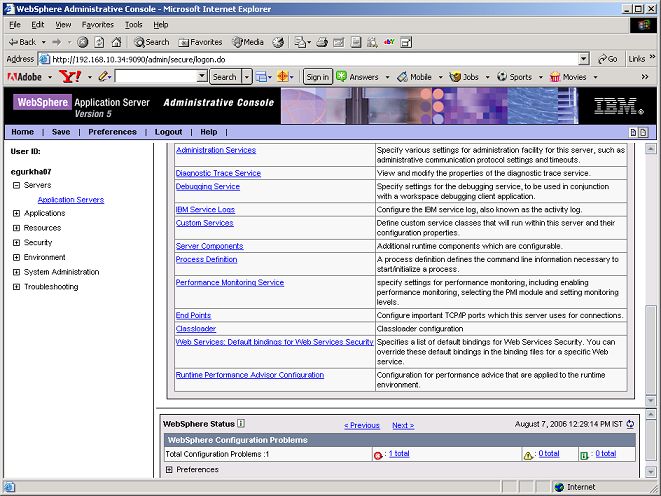
Scroll down the Configuration to view the End Points link (see Figure 11). Once you locate the End Points link, click on it.
-
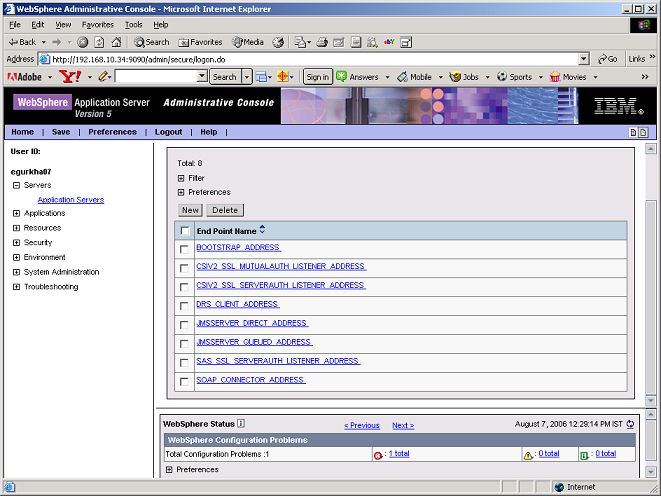
Figure 12 will then appear. Click on the SOAP_CONNECTOR_ADDRESS link in Figure 12.
-
The Port displayed in Figure 13 that appears should be used as the connectorport in situation (b).
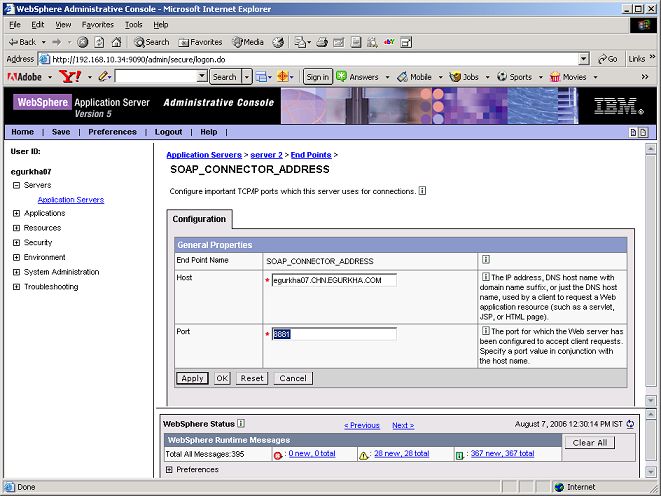
Figure 13 : Viewing the CONNECTORPORT of the server instance being monitored
If both (a) and (b) do not apply, specify none against connectorport.
- user - If security has been enabled for the WebSphere server being monitored, then provide a valid USER name to login to the WebSphere server. If the WebSphere server does not require any authentication, then the USER text box should contain the default value 'none'.
- password – If security has been enabled for the WebSphere server being monitored, then provide the password that corresponds to the specified user name. If the WebSphere server does not require any authentication, then leave the password text box with its default setting.
- confirm password - If security has been enabled, confirm the specified password by retyping it in the confirm password text box. If the WebSphere server does not require any authentication, then leave the confirm password text box with its default setting.
- encryptpass - By default, this flag is set to yes, indicating that the password of the WebSphere server is encrypted by default. To disable password encryption, select the no option.
- autodiscovery – By default, the eG suite allows administrators to configure EJB groups using the eG administrative interface, and reports metrics pertaining to every group so created. Accordingly, by default, autodiscovery is set to No. If you want EJBs to be discovered and monitored automatically, then select the Yes option against autodiscovery. When this is done, the eG agent automatically discovers all the EJBs on the WebSphere server, and reports one set of measures for every EJB hosted on the server.
- timeout - In the TIMEOUT text box, specify the maximum duration (in seconds) for which the test will wait for a response from the application server. The default TIMEOUT period is 60 seconds.
-
DETAILED DIAGNOSIS - To make diagnosis more efficient and accurate, the eG Enterprise embeds an optional detailed diagnostic capability. With this capability, the eG agents can be configured to run detailed, more elaborate tests as and when specific problems are detected. To enable the detailed diagnosis capability of this test for a particular server, choose the On option. To disable the capability, click on the Off option.
The option to selectively enable/disable the detailed diagnosis capability will be available only if the following conditions are fulfilled:
- The eG manager license should allow the detailed diagnosis capability
- Both the normal and abnormal frequencies configured for the detailed diagnosis measures should not be 0.
- Then, click on the Update button to save the changes.
- Now, wait for the test to run once, and then proceed to Reconfigure it for creating EJB groups. The eG agents will monitor only those EJB components of a WebSphere server that are part of an EJB group. To begin reconfiguring, click the Reconfigure button in the test configuration page. This results in the display of Figure 2. To configure the EJB groups, first click on the Click here hyperlink in Figure 2 and proceed in the same manner as discussed for the Ws Beans Test.
- Once the EJB Groups are configured, try signing out again. This time it will prompt only for the process pattern. All other tests have shared the Web Server port information that we gave.
-
So, click on Processes test and proceed to configure it.
Note:
For Processes Test configuring procedure, refer to Configuring and Monitoring Mail Servers document.
-
Remember that the process pattern has to be specified in the following format:
PROCESSNAME:PROCESSPATTERN
For example, the process pattern can be specified as below:
WebSphere:*/opt/WebSphere/AppServer/java/jre/bin/exe/java*-Xmx128m*-Xminf0.15*-Xmaxf0.25*–X*
- Use the context sensitive eG help to understand more about how this process pattern is coined.
- Upon completion of Processes test configuration, signout of the administrative interface.
- The WebSphere Application server is now ready to be monitored by eG.