JVM Memory Pool Garbage Collections Test
While the JVM Garbage Collections test reports statistics indicating how well each collector on the JVM performs garbage collection, the measures reported by the JVM Memory Pool Garbage Collections test help assess the impact of the garbage collection activity on the availability and usage of memory in each memory pool of the JVM. Besides revealing the count of garbage collections per collector and the time taken by each collector to perform garbage collection on the individual memory pools, the test also compares the amount of memory used and available for use pre and post garbage collection in each of the memory pools. This way, the test enables administrators to gauge the effectiveness of the garbage collection activity on the memory pools, and helps them accurately identify those memory pools where enough memory could not reclaimed or where the garbage collectors spent too much time.
Note:
This test will work only if the target Java application uses the JDK/JRE offered by one of the following vendors: Oracle, Sun, OpenJDK. IBM JDK/JRE is not supported.
Target of the test : An IBM WebSphere Liberty server
Agent deploying the test : An internal agent
Outputs of the test : One set of results for every GarbageCollector:MemoryPool pair on the JVM of the Java application being monitored.
| Parameter | Description |
|
Test period |
How often should the test be executed. |
|
Host |
The host for which the test is to be configured. |
|
Port |
The port number at which the specified host listens to. |
|
Measure Mode |
This test allows you the option to collect the desired metrics using one of the following methodologies:
To use JMX for metrics collections, set the Measure Mode to JMX. On the other hand, if you intend to use the GC log files for collecting the required metrics, set the Measure Mode to Log File. In this case, you would be required to enable GC logging. The procedure for this has been detailed in Enabling GC Logging. |
|
JREHome |
This parameter will be available only if the Measure Mode is set to Log File. Specify the full path to the Java Runtime Environment (JRE) used by the target application. |
|
Logfilename |
This parameter will be available only if the Measure Mode is set to Log File. Specify the full path to the GC log file to be used for metrics collection. |
|
Service URL Path |
For the eG agent to collect metrics from the target IBM WebSphere Liberty server, the local connector should be enabled on the target server. Once the connector is enabled, a com.ibm.ws.jmx.local.address file will be created in the ${server.output.dir}/logs/state folder. The eG agent uses this file to connect to the target server and collect the required metrics from it. Therefore, specify the exact path to this file in the Service URL text box. For example, in case of Windows environments, the Service URL Path can be C:\wlp\usr\servers\server1\logs\state and in case of Linux environments, the Service URL Path can be /opt/wlp/ur/servers/server1/logs/state. |
|
Timeout |
Specify the duration (in seconds) for which this test should wait for a response from the target Java application. If there is no response from the target beyond the configured duration, the test will timeout. By default, this is set to 240 seconds. |
| Measurement | Description | Measurement Unit | Interpretation | ||||||
|---|---|---|---|---|---|---|---|---|---|
|
Has garbage collection happened? |
Indicates whether garbage collection occurred on this memory pool in the last measurement period.
|
|
This measure reports the value Yes if garbage collection took place or No if it did not take place on the memory pool. The numeric values that correspond to the measure values of Yes and No are listed below:
Note: By default, this measure reports the value Yes or No to indicate whether a GC occurred on a memory pool or not. The graph of this measure however, represents the same using the numeric equivalents – 0 or 1. |
||||||
|
Collection count |
Indicates the number of time in the last measurement pool garbage collection was started on this memory pool. |
Number |
|
||||||
|
Initial memory before GC |
Indicates the initial amount of memory (in MB) that this memory pool requests from the operating system for memory management during startup, before GC process. |
MB |
Comparing the value of these two measures for a memory pool will give you a fair idea of the effectiveness of the garbage collection activity. If garbage collection reclaims a large amount of memory from the memory pool, then the Initial memory after GC will drop. On the other hand, if the garbage collector does not reclaim much memory from a memory pool, or if the Java application suddenly runs a memory-intensive process when GC is being performed, then the Initial memory after GC may be higher than the Initial memory before GC. |
||||||
|
Initial memory after GC |
Indicates the initial amount of memory (in MB) that this memory pool requests from the operating system for memory management during startup, after GC process |
MB |
|||||||
|
Max memory before GC |
Indicates the maximum amount of memory that can be used for memory management by this memory pool, before GC process. |
MB |
Comparing the value of these two measures for a memory pool will provide you with insights into the effectiveness of the garbage collection activity. If garbage collection reclaims a large amount of memory from the memory pool, then the Max memory after GC will drop. On the other hand, if the garbage collector does not reclaim much memory from a memory pool, or if the Java application suddenly runs a memory-intensive process when GC is being performed, then the Max memory after GC value may exceed the Max memory before GC. |
||||||
|
Max memory after GC |
Indicates the maximum amount of memory (in MB) that can be used for memory management by this pool, after the GC process. |
MB |
|||||||
|
Committed memory before GC |
Indicates the amount of memory that is guaranteed to be available for use by this memory pool, before the GC process. |
MB |
|
||||||
|
Committed memory after GC |
Indicates the amount of memory that is guaranteed to be available for use by this memory pool, after the GC process. |
MB |
|
||||||
|
Used memory before GC |
Indicates the amount of memory used by this memory pool before GC. |
MB |
Comparing the value of these two measures for a memory pool will provide you with insights into the effectiveness of the garbage collection activity. If garbage collection reclaims a large amount of memory from the memory pool, then the Used memory after GC may drop lower than the Used memory before GC. On the other hand, if the garbage collector does not reclaim much memory from a memory pool, or if the Java application suddenly runs a memory-intensive process when GC is being performed, then the Used memory after GC value may exceed the Used memory before GC. |
||||||
|
Used memory after GC |
Indicates the amount of memory used by this memory pool after GC. |
MB |
|||||||
|
Percentage of memory collected |
Indicates the percentage of memory collected from this pool by the GC activity. |
Percent |
A high value for this measure is indicative of a large amount of unused memory in the pool. A low value on the other hand indicates that the memory pool has been over-utilized. Compare the value of this measure across pools to identify the pools that have very little free memory. If too many pools appear to be running short of memory, it could indicate that the target application is consuming too much memory, which in the long run, can slow down the application significantly. |
||||||
|
Collection duration |
Indicates the time taken by this garbage collector for collecting unused memory from this pool. |
Mins |
Ideally, the value of this measure should be low. This is because, the garbage collection (GC) activity tends to suspend the operations of the application until such time that GC ends. Longer the GC time, longer it would take for the application to resume its functions. To minimize the impact of GC on application performance, it is best to ensure that GC activity does not take too long to complete. |
Enabling GC Logging
If you want the JVM Memory Pools Garbage Collections test to use the GC log file to report metrics, then, you first need to enable GC logging. For this, follow the steps below:
-
Edit the startup script file of the Java application being monitored. Figure 1 depicts the startup script file of a sample application.
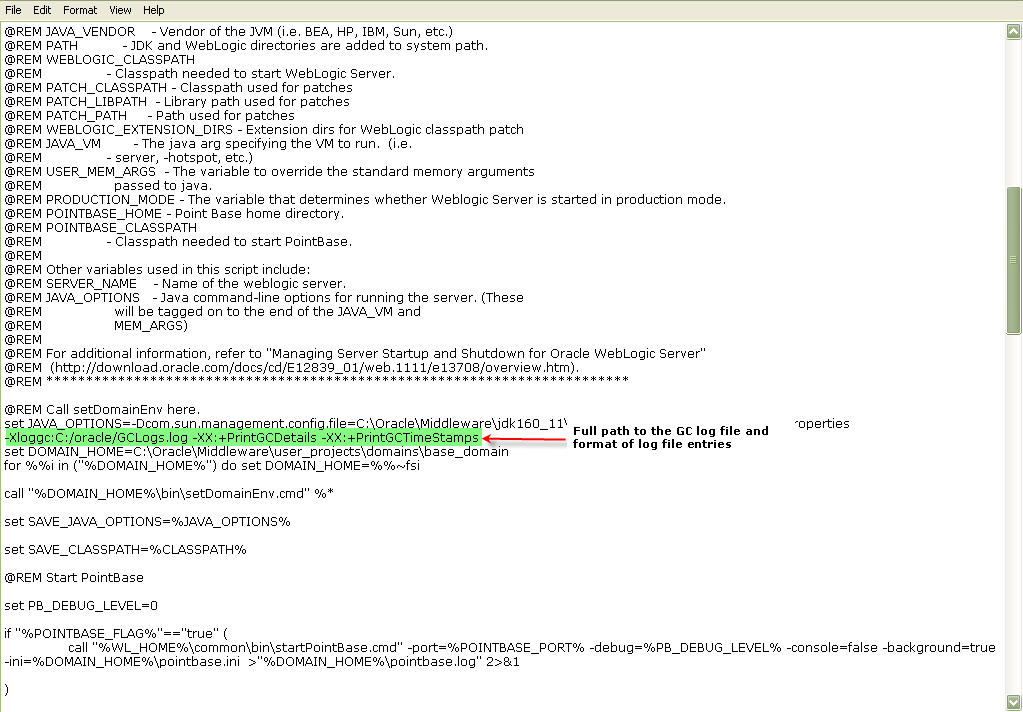
Figure 1 : Editing the startup script file of a sample Java application
-
Add the line indicated by Figure 1 to the startup script file. This line should be of the following format:
-Xloggc:<Full path to the GC log file to which GC details are to be logged> -XX:+PrintGCDetails -XX:+PrintGCTimeStamps
Here, the entry, -XX:+PrintGCDetails -XX:+PrintGCTimeStamps, refers to the format in which GC details are to be logged in the specified log file. Note that this test can monitor only those GC log files which contain log entries of this format.
- Finally, save the file and restart the application.