Monitoring the IBM WebSphere Liberty Server
The eG Enterprise facilitates 24x7 monitoring of the IBM WebSphere Liberty server and proactive alerting of probable error conditions detected on the server.
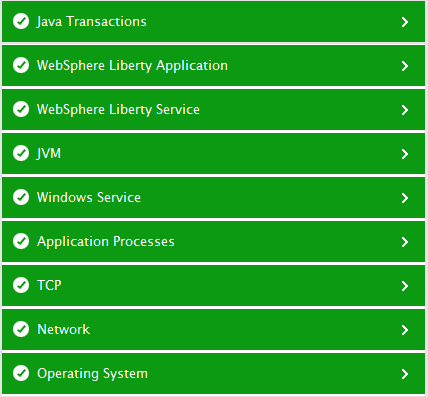
Figure 1 : The layer model of the IBM WebSphere Liberty server
Each layer of Figure 1 above is mapped to a variety of tests that execute on the IBM WebSphere Liberty server and collect performance statistics that reveal the following:
- What is the rate at which each servlet is hit with requests?
- What is the average time taken by each servlet to respond to requests? Which servlet is taking too long to respond to requests?
- How many active sessions are currently accessing each WAR file deployed on the target IBM WebSphere Liberty server?
- How many invalidated sessions are accessing each WAR file deployed on the target IBM WebSphere Liberty server?
- How many sessions are accessing each WAR file per second?
- What is the current state of each web application deployed on the target IBM WebSphere Liberty server?
- What is the current state of each queue on the target IBM WebSphere Liberty server?
- What is the maximum configured size of each queue?
- What is the current queue depth of each queue? Which queue is latent and is unable to process I/O requests quickly?
- Are get operations allowed on each queue?
- What is the maximum configures size of each topic?
- Are get operations allowed on each topic?
- What is the current depth of each topic? Which topic is latent and is unable to process I/O requests quickly?
- What is the size of each thread pool?
- Haw many active threads are there in each thread pool?
- How well the CPU is utilized by the JVM engine?
- How well does the JVM engine manage memory?
- What is the uptime of the JVM engine?
- How many classes have been loaded/unloaded from memory of the JVM engine?
- Did garbage collection take too long to complete? If so, which memory pools spent too much time in garbage collection?
- Are too many threads in waiting state in the JVM?
- Which threads in the JVM are consuming CPU?
The chapters that follow elaborately discusses the top 4 layers of the IBM WebSphere Liberty server monitoring model, and discusses the tests and measures mapped to each layer.