MQ Channel Usage Test
This test connects to a WebSphere MQ server, auto-discovers the channels that have been configured for this server, and monitors the instances of each channel. Using this test, administrators can figure out the utilization of the instances in each channel and identify the channel that is overloaded in terms of instances. This test also throws light on the maximum number of instances configured for the channels.
Target of the test : A WebSphere MQ server
Agent deploying the test : An internal agent
Outputs of the test : One set of results for every channel configured for the WebSphere MQ server.
|
Parameter |
Description |
|---|---|
|
Test period |
How often should the test be executed. |
|
Host |
The host for which the test is to be configured. |
|
Port |
The port number at which the specified host listens. |
|
User |
If you want to login as a specific MQ user to execute this test, then specify a valid user name in the User text box. The test will fail if an invalid user name is specified here. If no such authentication is required, then this parameter can be set to 'none'. If the user belongs to an Active Directory group, then, specify the user name in the following format: <username>@<domain name>. For example, if the user belongs to eginnovations/john, then, your specification should be: john@eginnovations.com. |
|
Password |
If a specific User is entered, then the password of that user has to be specified in the Password text box. |
|
Confirm Password |
Confirm the password by retyping it in the Confirm Password text box. |
|
ServerConnChannel |
The name of the server connection channel for the WebSphere MQ server. The default value is "SYSTEM.DEF.SVRCONN". If you prefer not to use this default server connection channel for monitoring purposes, then you can create a custom channel in the WebSphere MQ server and use it for monitoring. The steps for achieving this have been detailed in Creating a Custom Channel |
|
SSL Cipher Spec |
This parameter is applicable only if SSL-enabled channel is used for communication to the target MQ server, if not, set this parameter to none. A cipher suite is a set of cryptographic algorithms that are used before a client application and server exchange information over an SSL/TLS connection. It consist of sets of instructions on how to secure a network through SSL (Secure Sockets Layer) or TLS (Transport Layer Security). In this text box, provide the cipher suite that is allowed for SSL/TLS connection to the target server. By default, this parameter is set to none. To know if SSL-enabled channel is used for communication, refer to Enabling One-Way SSL Communication on the Channel |
|
Two Way SSL |
This parameter is applicable only if SSL-enabled channel is used for communication to the target MQ server, if not, set this flag to No. If two-way SSL authentication is used then set this flag to Yes. Set this flag to No if one-wy SSL communication is used. |
|
Truststore |
This parameter is applicable only if SSL-enabled channel is used for communication to the target MQ server, if not, set this parameter to none. Truststore is used to store certificates from Certified Authorities (CA) that verify and authenticate the certificate presented by the server in an SSL connection. Therefore, the eG agent should have access to the truststore where the certificates are stored to authenticate and connect with the target server and collect metrics. For this, first extract the certificates from the server into the following default location /opt/egurkha/jre/lib/security/egmqsslstore.jks. To know how to create and extract the certificate into the truststore, refer to Configuring the eG Agent to Monitor the Queue Manager. Then, provide the truststore file name in this text box. For example: egmqsslstore.jks. However, if you are using a different location to store the certificate then, provide the full path to this file in this text box. By default, none is specified against this text box. |
|
Truststore Password |
This parameter is applicable only if SSL-enabled channel is used for communication to the target MQ server, if not, set this parameter to none. If a Truststore File name or file path is provided, then, in this text box, provide the password that is used to obtain the associated certificate details from the Truststore File. |
|
Confirm Password |
This parameter is applicable only if SSL-enabled channel is used for communication to the target MQ server, if not, set this parameter to none. Confirm the password by retyping it in this text box. |
|
Keystore |
This parameter is applicable only if two-way SSL authentication is used, if not, set this parameter to none. Keystore contains the private keys for the certificates that the client can provide to the server upon request. eG agent requires access to the keystore where client certificate is stored to send that to the server so that the server validates the certificate against the one contained in its trustore. For this purpose, first create the client certificate in the following default location /opt/egurkha/jre/lib/security/egmqsslstore.jks. To know how to create the certificate, refer to Configuring the eG Agent to Monitor the Queue Manager. Then, provide the keystore file name in this text box. For example:egmqsslstore.jks. However, if you are using a different location to store the certificate then, provide the full path to this file in this text box. By default, none is specified against this text box. If you are using one-way SSL authentication, this parameter is set to none. |
|
Keystore Password |
This parameter is applicable only if two-way SSL authentication is used, if not, set this parameter to none. If a Keystore File name or file path is provided, then, in this text box, provide the password that is used to obtain the associated certificate details from the Keystore File. |
|
Confirm Password |
This parameter is applicable only if two-way SSL authentication is used, if not, set this parameter to none. Confirm the password by retyping it in this text box. |
|
MQ Home |
Specify the full path to the install directory of the IBM WebSphere MQ server. For example, if the IBM WebSphere MQ server is installed on a Windows operating system, then the path will be C:\Program Files\IBM\WebSphere MQ. On the other hand, if the target server is installed on Linux operating system, then, the path will be /opt/mqm. |
|
Queue Manager Home |
Specify the full path to the install directory fo the Queue Manager. For example, if the IBM WebSphere MQ server is installed on a Windows operating system, then, the path will be C:\Program Files\IBM\WebSphere MQ\Qmgrs\MAS!EG!QM1. On the other hand, if the IBM WebSphere MQ is installed on Linux operating system, then, the full path to the Queue Manager Home will be /var/mqm/qmgrs/IB9QMGRx. |
|
Timeout |
Specify the time duration (in seconds) beyond which this test should time out in the Timeout text box. The default is 60 seconds. |
|
DD Frequency |
Refers to the frequency with which detailed diagnosis measures are to be generated for this test. The default is 1:1. This indicates that, by default, detailed measures will be generated every time this test runs, and also every time the test detects a problem. You can modify this frequency, if you so desire. Also, if you intend to disable the detailed diagnosis capability for this test, you can do so by specifying none against DD Frequency. |
|
Detailed Diagnosis |
To make diagnosis more efficient and accurate, the eG Enterprise embeds an optional detailed diagnostic capability. With this capability, the eG agents can be configured to run detailed, more elaborate tests as and when specific problems are detected. To enable the detailed diagnosis capability of this test for a particular server, choose the On option. To disable the capability, click on the Off option. The option to selectively enable/disable the detailed diagnosis capability will be available only if the following conditions are fulfilled:
|
| Measurement | Description | Measurement Unit | Interpretation |
|---|---|---|---|
|
Current instances |
Indicates the number of instances of this channel currently connected to the Queue Manager. |
Number |
This measure is a good indicator of the load on each channel. Compare the value of this measure across channels to identify the channel with maximum number of instances connected to the Queue Manager. A value close to the Maximum Instances measure indicates that the channel is running out of instances. The detailed diagnosis of this measure lists the Host to which the server is connected, count of current instances, percentage of instance usage, count of inactive instances and the maximum number of instances allocated per client. |
|
Instance usage |
Indicates the percentage of instances of this channel currently connected to the Queue Manager. |
Percent |
Compare the value of this measure across channels to figure out the channel that is most sought after. |
|
Free instances |
Indicates the number of instances of this channel that are currently available to connect to the Queue Manager. |
Number |
Compare the value of this measure across the channels to figure out the channel that is least sought by the users. |
|
Percent free instances |
Indicates the percentage of instances of this channel that are currently available to connect to the Queue Manager. |
Number |
|
|
Maximum instances |
Indicates the maximum number of instances that can be held by this channel. |
Number |
|
The detailed diagnosis of the Current instances measure lists the Host to which the server is connected, count of current instances, percentage of instance usage, count of inactive instances and the maximum number of instances allocated per client.
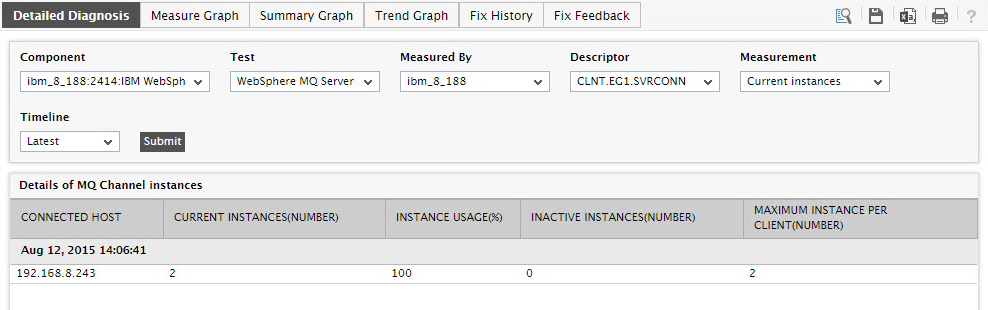
Figure 1 : The detailed diagnosis of the Current instances measure