Monitoring IGEL Endpoints
eG Enterprise offers a specialized IGEL Endpoints model out-of-the-box, for monitoring the load, configuration, and usage of each IGEL Endpoint in a target IGEL Endpoints component. The tests mapped to this component report metrics that have been collected from those Endpoint Agents that have been configured to communicate to the same IGEL Endpoints component - i.e., that have been configured with the same IGEL Endpoints component nick name. With the metrics reported by the model, administrators can find quick and accurate answers to the following:
-
Did any IGEL Endpoint experience an unscheduled reboot recently?
-
Is any IGEL Endpoint running out of disk, CPU or resources? Which application on the IGEL Endpoint is draining the resources? Which user is accessing such applications?
-
Are TCP connects to any IGEL Endpoint dropping frequently?
-
Is any IGEL Endpoint experiencing an unusually high rate of TCP reransmissions?
-
Is any IGEL Endpoint experiencing high rate of incoming/outgoing traffic through any network interface?
To access these metrics, do the following:
-
Login to the eG monitoring console.
-
Close the Current Alarms window that pops up to focus on the Monitor Dashboard.
-
In the Components At-A-Glance section of the Monitor Dashboard, locate the bar graph representing the number of IGEL Endpoints that are being monitored and their current state.
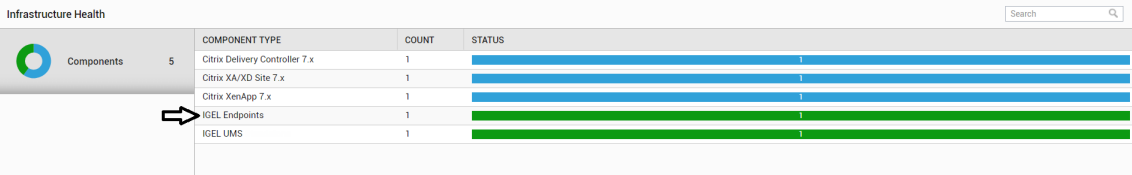
Figure 1 : The Monitor Dashboard
-
Click on a division (denoting a state) in the bar to know which IGEL Endpoints are in that particular state. If only one IGEL Endpoints component is managed, then the bar will represent the current state of that component alone. In this case, clicking on the bar will open Figure 2, displaying the IGEL Endpoints that are connected to the IGEL Endpoints component that you clicked on, and the health of each IGEL Endpoint.
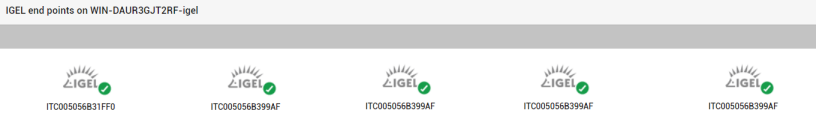
Figure 2 : The IGEL Endpoints connected to an IGEL Endpoints component
-
Click on an Endpoint in Figure 2 to zoom into its performance.
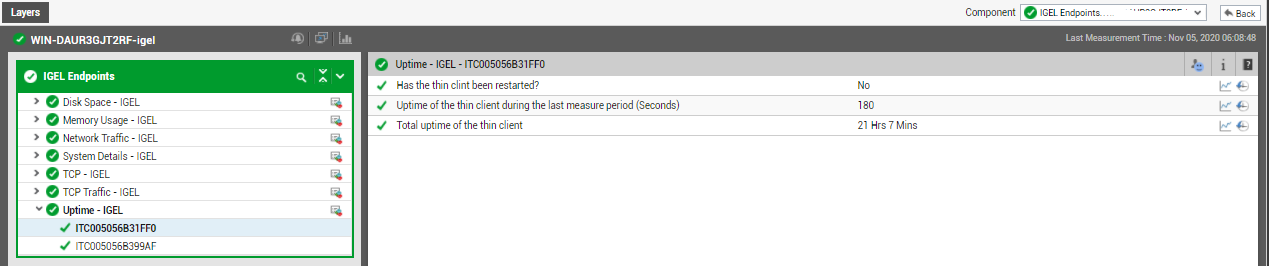
- In Figure 3 that then appears, you will find an IGEL Endpoint drop-down that will display the IGEL Endpoint that you clicked on in Figure 2. You can switch to any other IGEL Endpoint by selecting that endpoint from the IGEL Endpoint drop-down. The metrics related to the chosen IGEL Endpoint will then be displayed in the Measures tab page that appears below. These metrics will be organized and displayed in tab pages - one each for every layer.