Application Pool Workers Test
An application pool is a group of one or more URLs that are served by a worker process or a set of worker processes. Application pools set boundaries for the applications/web sites they contain, which means that applications/web sites that are running outside a given application pool cannot affect the applications/web sites in the application pool. On the other hand, a single resource-intensive application/web site within a pool can affect overall pool performance, and eventually impact web server performance adversely! This poses a huge management challenge, particularly in MSP environments, where a single web server may host multiple web sites – one each for every MSP customer. A web server slowdown in such environments often leaves administrators flummoxed, as they struggle to fathom what problem in which web site of which application pool is responsible for the slowdown. This is where the Application Pool Workers test helps!
By periodically monitoring the overall status, requests, resource usage, open handles, and I/O activity in each application pool on an IIS web server, the test quickly and accurately points you to the problematic application pool and the nature of its problem – has the application pool stopped? is a web site/application in the pool utilizing resources excessively? is any handle leak detected in the pool? is there any I/O processing bottleneck in the pool? is any web site/applicationn in the pool responding slowly to user requests? You can even quickly drill down to the exact web site/application that is causing this problem, using the detailed diagnosis capability of the test. In addition, the test also captures and reports operational issues with the worker processes that service requests to an application pool, thereby shedding light on the contribution of worker processes to slowdowns/outages that a web server suffers.
Target of the test : An IIS web server
Agent deploying the test : An internal agent;
Outputs of the test : One set of results for every application pool on the IIS web server monitored
|
| Measurement | Description | Measurement Unit | Interpretation | ||||||
|---|---|---|---|---|---|---|---|---|---|
|
Pool status |
Indicates the current status of this application pool. |
|
The values that this measure can report and their corresponding numeric values have been listed in the table below:
If this measure reports the value Sopped, then you need to make sure that the application pool is started. If a pool has stopped, then you can use the detailed diagnosis of this measure to identify the applications/web sites that are impacted as a result of this pool stopping. This measure is reported for IIS v6 (and above) only. Note: By default, the measure reports the Measure Values listed in the table above to indicate the status of the application pool. The graph of this measure however represents the same using the numeric equivalents only. |
||||||
|
Has pool been restarted? |
Indicates whether this pool is restarted or not. |
|
The values that this measure can report and their corresponding numeric values have been listed in the table below:
This measure is reported for IIS v7 (and above) only. Note: By default, the measure reports the Measure Values listed in the table above to indicate the restart status of the application pool. The graph of this measure however represents the same using the numeric equivalents only. |
||||||
|
Number of processes |
Indicates the number of worker processes that are currently servicing requests to this application pool. |
Number |
A zero value in this measure indicates that the application pool has crashed. Use the detailed diagnosis of this measure to know the pid of every worker process that is handling requests to this pool and the command line argument revealing the name of the application/web site in the application pool, which is accessed by that worker process. In addition, the detailed diagnosis also displays the websites associated with the worker process, resource allocations (private data, pool paged data, non pool paged data), the resource usage (CPU and memory), open handle count, thread count, and I/O activity of each application in the pool that is accessed by every worker process. This way, resource-intensive applications in the pool can be isolated. This measure is reported for IIS v6 (and above) only. |
||||||
|
CPU utilization |
Indicates the percentage CPU utilization of this application pool. |
Percent |
A higher value indicates excessive CPU utilization. Use the detailed diagnosis of this measure to know the pid of every worker process that is handling requests to this pool and the command line argument revealing the name of the application/web site in the application pool, which is accessed by that worker process. In addition, the detailed diagnosis also displays the websites associated with the worker process, resource allocations (private data, pool paged data, non pool paged data), the resource usage (CPU and memory), open handle count, thread count, and I/O activity of each application in the pool that is accessed by every worker process. This way, resource-intensive applications in the pool can be isolated. This measure is reported for IIS v6 (and above) only. |
||||||
|
Memory utilization |
Indicates the percentage of total memory utilized by this application pool. |
Percent |
If the value of this measure consistently increases, it indicates a memory bottleneck. Use the detailed diagnosis of this measure to know the pid of every worker process that is handling requests to this pool and the command line argument revealing the name of the application/web site in the application pool, which is accessed by that worker process. In addition, the detailed diagnosis also displays the websites associated with the worker process, resource allocations (private data, pool paged data, non pool paged data), the resource usage (CPU and memory), open handle count, thread count, and I/O activity of each application in the pool that is accessed by every worker process. This way, resource-intensive applications in the pool can be isolated. This measure is reported for IIS v6 (and above) only. |
||||||
|
Number of threads |
Indicates the number of threads that are currently active in this application pool. |
Number |
This is an indicator of the workload on the pool. This measure is reported for IIS v6 (and above) only. |
||||||
|
Number of handles |
Indicates the number of handles currently opened by this application pool. |
Number |
A sudden/consistent increase in the value of this measure could indicate a handle leak in the pool. This measure is reported for IIS v6 (and above) only. |
||||||
|
Page faults |
Indicates the rate of page faults happening in this application pool. |
Faults/Sec |
This measure is reported for IIS v6 (and above) only. |
||||||
|
Private data |
Indicates the amount of data that this application pool has currently allocated and cannot be shared with other application pools. |
MB |
A gradual growth in this measure indicates a memory leak in the websites that are running in this application pool. This measure is reported for IIS v6 (and above) only. |
||||||
|
Pool paged data |
Indicates the amount of memory currently allocated from the paged pool to this application pool. The Paged Pool is an area of the System's virtual memory that is limited in size and used for various system related functions. |
MB |
A gradual growth in this measure indicates a memory leak in the websites that are running in the application pool. This measure is reported for IIS v6 (and above) only. |
||||||
|
Pool non paged data |
Indicates the amount of memory currently allocated from the non-paged pool to this application pool. The Non-Paged Pool is an area of the System's virtual memory that is limited in size and used for kernel and device driver functions. |
MB |
A gradual growth in this measure indicates a memory leak in the websites that are running in the application pool. Running out of space in the nonpaged pool often results in a Blue Screen. This measure is reported for IIS v6 (and above) only. |
||||||
|
I/O reads |
Indicates the rate at which the worker process(es) servicing requests to this application pool is reading data. |
KBytes/Sec |
These measures are reported for IIS v6 (and above) only. Use the detailed diagnosis of these measures to know the pid of every worker process that is handling requests to this pool and the command line argument revealing the name of the application/web site in the application pool, which is accessed by that worker process. In addition, the detailed diagnosis also displays the websites associated with the worker process, resource allocations (private data, pool paged data, non pool paged data), the resource usage (CPU and memory), open handle count, thread count, and I/O activity of each application in the pool that is accessed by every worker process. This way, resource-intensive applications in the pool can be isolated. A very low or a consistent dip in the value of these measures is a cause for concern, as it could indicate a bottleneck when processing read requests to the application pool. You can compare the value of these measures across pools, to identify that application pool that is the slowest in read request processing. |
||||||
|
I/O read operations |
Indicates the rate at which the worker process(es) serving requests to this pool is performing I/O reads. |
Operations/Sec |
|||||||
|
I/O writes |
Indicates the rate at which the worker process(es) serving requests to this pool is writing data. |
KBytes/Sec |
These measures are reported for IIS v6 (and above) only. Use the detailed diagnosis of these measures to know the pid of every worker process that is handling requests to this pool and the command line argument revealing the name of the application/web site in the application pool, which is accessed by that worker process. In addition, the detailed diagnosis also displays the websites associated with the worker process, resource allocations (private data, pool paged data, non pool paged data), the resource usage (CPU and memory), open handle count, thread count, and I/O activity of each application in the pool that is accessed by every worker process. This way, resource-intensive applications in the pool can be isolated. A very low or a consistent dip in the value of these measures is a cause for concern, as it could indicate a bottleneck when processing write requests to the application pool. You can compare the value of these measures across pools, to identify that application pool that is the slowest in write request processing. |
||||||
|
I/O write operations |
Indicates the rate at which the worker process(es) serving requests to this pool is issuing write I/O commands. |
Operations/Sec |
|||||||
|
Pool uptime during the last measure period |
Indicates the length of time, in seconds, that this application pool has been running since it was started. |
Secs |
|
||||||
|
Current process |
Indicates the number of worker processes currently servicing requests to this application pool. |
Number |
This measure is reported for IIS v7 (and above) only. |
||||||
|
Recent failure |
Indicates the number of times the worker processes associated with this pool failed during the rapid-fail protection interval. |
Number |
Rapid Fail Protection is a feature in IIS 7, which is enabled by default. This feature checks for a specified number of hard failures in a given time period - 5 failures within 5 minutes by default. If a hard failure that occurs meets this default setting, then the Application Pool will crash and does not automatically restart. It would be good practice to set the hard failure setting as the threshold for this measure; this way, you can be proactively alerted to a potential application pool crash. This measure is reported for IIS v7 (and above) only. |
||||||
|
Pool recycle |
Indicates the number of times this application pool was recycled since Windows Process Activation Service (WAS) started. |
Number |
If you have a problematic application and you cannot easily correct the code that causes the problems, you can limit the extent of these problems by periodically recycling the worker process that services the application. In addition to recycling an application pool on demand when problems occur, you can configure an application pool to recycle a worker process for the following reasons:
This measure is reported for IIS v7 (and above) only. |
||||||
|
Startup failure |
Indicates the number of times that Windows Process Activation Service (WAS) failed to start a worker process that serves requests to this application pool. |
Number |
Ideally, the value of this measure should be 0. This measure is reported for IIS v7 (and above) only. |
||||||
|
Total failure |
Indicates the number of times the worker processes handling requests to this pool have crashed since the application pool was started. |
Number |
Ideally, the value of this measure should be 0. This measure is reported for IIS v7 (and above) only. |
||||||
|
Ping failure |
Indicates the number of times the Windows Process Activation Service (WAS) did not receive a response to ping messages sent to a worker process that serves requests to this application pool. |
Number |
IIS periodically pings a worker process to determine its responsiveness. A high value of this measure indicates that very often the worker process is too busy to respond to these ping requests. This may sometimes force IIS to terminate the worker process. Since the worker process clings on to areas of memory, the termination attempt may fail. As a result, errors/delays may occur when users attempt to hit specific web pages on the IIS web server. To avoid this, you can either disable the Ping, or increase the Ping Maximum Response Time. This measure is reported for IIS v7 (and above) only. |
||||||
|
Shutdown failure |
Indicates the number of times that Windows Process Activation Service (WAS) failed to shut down a worker process servicing requests to this application pool. |
Number |
This measure is reported for IIS v7 (and above) only. |
||||||
|
Initialized threads |
Indicates the number of threads that are currently in an initialized state in this application pool. |
Number |
|
||||||
|
Ready threads |
Indicates the number of threads that are currently in the ‘Ready’ state in this application pool. |
Number |
A Ready thread wants to use a processor but is waiting because none is free. A high value for this measure is therefore indicative of a potential processor contention, probably caused by an overload or a processing bottleneck in the application pool. |
||||||
|
Running threads |
Indicates the numberof threads that are currently in the ‘Running’ state in this application pool. |
Number |
This measure is a good indicator of the current workload on the application pool. |
||||||
|
Threads in STANDBY state: |
Indicates the number of threads that are currently in the STANDBY state in this application pool. |
Number |
A STANDBY thread is about to use a processor. |
||||||
|
Terminated threads |
Indicates the number of threads that are currently in a TERMINATED state in this application pool. |
Number |
A low value is desired for this measure. |
||||||
|
Threads in WAIT state |
Indicates the number of threads that are in the WAIT state in this application pool. |
Number |
A waiting thread has no use for a processor because it is waiting for a peripheral operation or a resource to become free. A high value for this measure could hint at a potential resource contention. |
||||||
|
Threads in TRANSITION state |
Indicates the number of threads that are currently in the TRANSITION state in this pool. |
Number |
A thread in transition is waiting for a resource in order to execute, such as waiting for its execution stack to be paged in from a disk. |
||||||
|
Threads in UNKNOWN state |
Indicates the number of threads that are currently in the UNKNOWN state in this application pool. |
Number |
Ideally, the value of this measure should be 0.
|
||||||
|
Percentage of running threads |
Indicates the percentage of threads that are currently in the RUNNING state in this application pool. |
Percent |
A high value is desired for this measure, as it indicates that that the application pool has adequate active threads to process its requests. |
||||||
|
Actively processing request threads |
Indicates the number of threads actively processing requests in the worker process that is serving requests to this pool. |
Number |
|
||||||
|
Requests being processed |
Indicates the total number of requests that this application pool is processing currently. |
Number |
This is a good indicator of the current workload of an application pool. To view the details of active requests, use the detailed diagnosis of this measure. |
||||||
|
Slow requests |
Indicates the number of requests to this pool that are slow. |
Number |
Ideally, the value of this measure should be 0. A non-zero value denotes that requests to one/more web sites/applications in this pool have violated the SLOW REQUEST CUT OFF configured for this test. Compare the value of this measure across pools to know which pool contains the slowest web sites/applications. To know which are the slow web sites/applications in the pool, use the detailed diagnosis of this measure. |
||||||
|
Current file cache memory usage |
Indicates the amount of memory used by user-mode file cache of the worker process that is serving requests to this pool. |
MB |
|
||||||
|
Current files cached |
Indicates the current number of files whose contents are present in the user-mode file cache of the worker process that is serving requests to this pool. |
Number |
|
||||||
|
Requests rate |
Indicates the number of HTTP requests/sec being processed by the worker process that is serving requests to this pool. |
Requests/Sec |
|
||||||
|
HTTP requests served |
Indicates the total number of HTTP requests served by the worker process that is serving requests to this pool. |
Number |
|
||||||
|
Available threads to process requests |
Indicates the total number of threads available to process requests in the worker process that is serving requests to this pool. |
Number |
By closely monitoring the thread usage over time, you can proactively capture when the worker process runs out of idle threads, and promptly take corrective measures, so as to avert any processing bottlenecks. |
||||||
|
Max threads from thread pool |
Indicates the maximum number of threads to which this thread pool can grow.
|
Number |
|
Use the detailed diagnosis of the Pool status measure to identify the applications/web sites that are impacted as a result of the pool stopping.
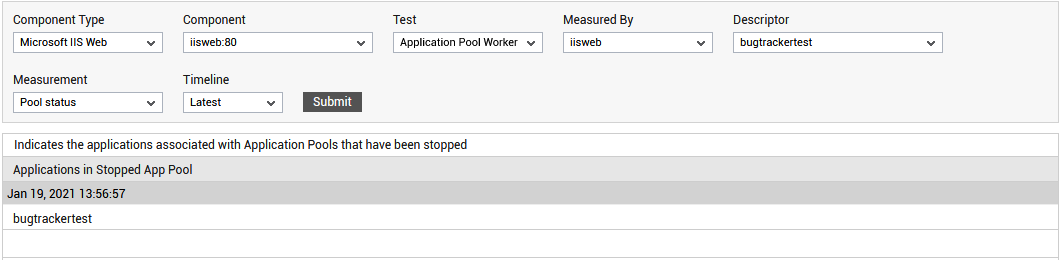
Figure 1 : The detailed diagnosis of the Pool status measure of the Application Worker Processes test
Use the detailed diagnosis of the Number of processes measure to know the pid of every worker process that is handling requests to this pool and the command line argument revealing the name of the application/web site in the application pool, which is accessed by that worker process. In addition, the detailed diagnosis also displays the websites associated with the worker process, resource allocations (private data, pool paged data, non pool paged data), the resource usage (CPU and memory), open handle count, thread count, and I/O activity of each application in the pool that is accessed by every worker process. This way, resource-intensive applications in the pool can be isolated.
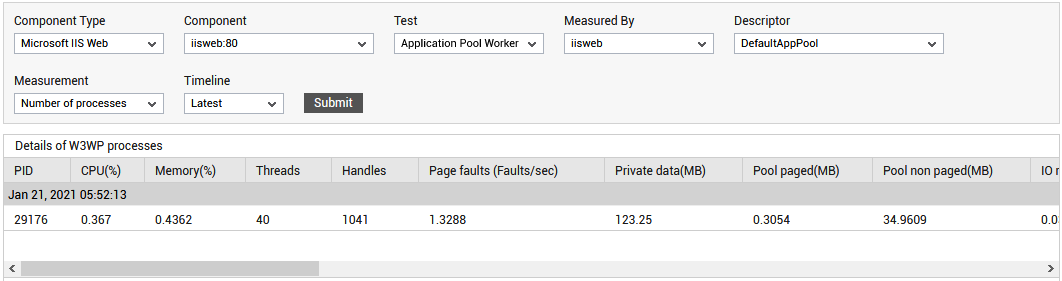
Figure 2 : The detailed diagnosis of the Number of processes measure of the Application Worker Processes test
Use the detailed diagnosis of the CPU utilization measure to know the pid of every worker process that is handling requests to a pool and the command line argument revealing the name of the application/web site in the application pool, which is accessed by that worker process. In addition, the detailed diagnosis also displays the websites associated with the worker process, resource allocations (private data, pool paged data, non pool paged data), the resource usage (CPU and memory), open handle count, thread count, and I/O activity of each application in the pool that is accessed by every worker process.
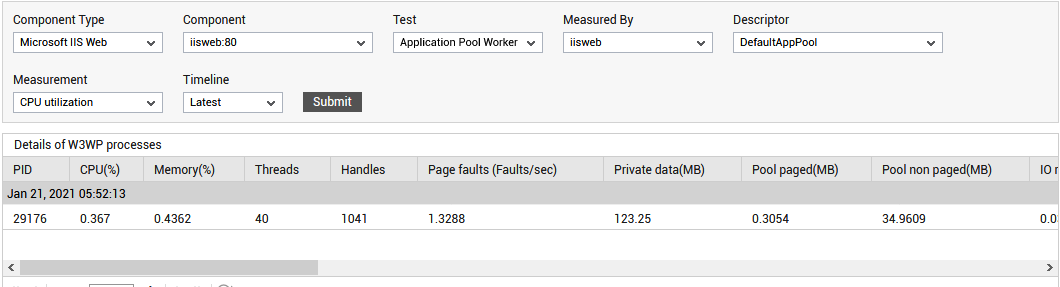
Figure 3 : The detailed diagnosis of the CPU utilization measure of the Application Worker Processes test
Use the detailed diagnosis of the Memory utilization measure to know the pid of every worker process that is handling requests to this pool and the command line argument revealing the name of the application/web site in the application pool, which is accessed by that worker process. In addition, the detailed diagnosis also displays the websites associated with the worker process, resource allocations (private data, pool paged data, non pool paged data), the resource usage (CPU and memory), open handle count, thread count, and I/O activity of each application in the pool that is accessed by every worker process.
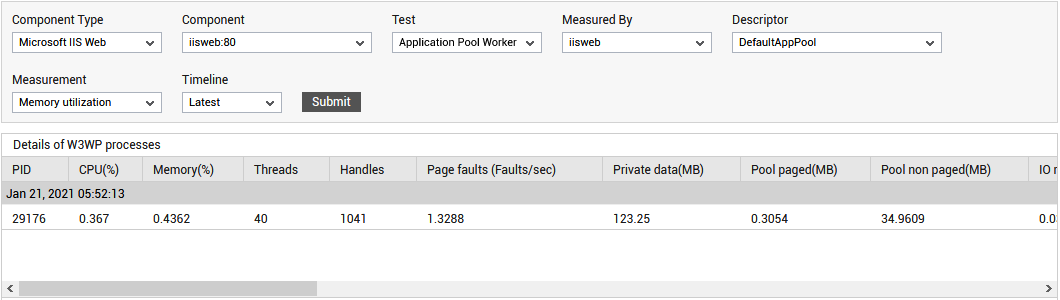
Figure 4 : The detailed diagnosis of the Memory utilization measure of the Application Worker Processes test
Use the detailed diagnosis of the I/O reads, I/O read operations, I/O waits and I/O wait operations measures to know the pid of every worker process that is handling requests to a pool and the command line argument revealing the name of the application/web site in the application pool, which is accessed by that worker process. In addition, the detailed diagnosis also displays the websites associated with the worker process, resource allocations (private data, pool paged data, non pool paged data), the resource usage (CPU and memory), open handle count, thread count, and I/O read activity of each application in the pool that is accessed by every worker process. For example, the following figure shows the detailed diagnosis reported by the I/O reads measure.
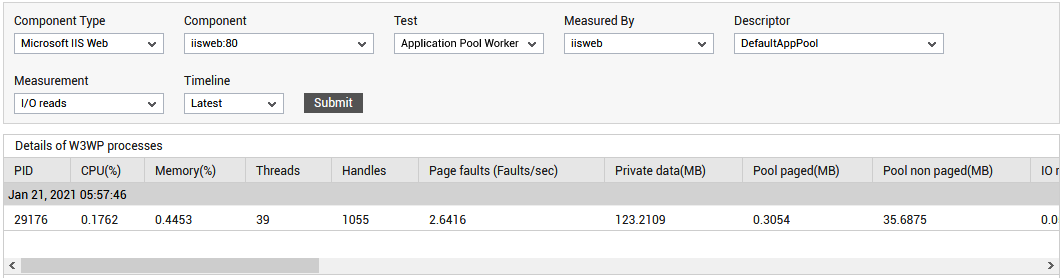
Figure 5 : The detailed diagnosis of the I/O reads measure of the Application Worker Processes test
The detailed diagnosis of the Requests being processed measure reveals the details of the active requests to the application pool. The request URL, the type of request (Verb), the stage, module name, the web site to which the request pertains, the worker process that processed the request, the client from which the request originated, and the time taken to process the request are reported as part of the detailed diagnostics. From this information, administrators can proactively detect a potential request processing bottleneck, and can initiate preventive measures immediately. Additionally, administrators can also figure out if many requests to a web site are slowing down, and thus isolate problematic web sites.
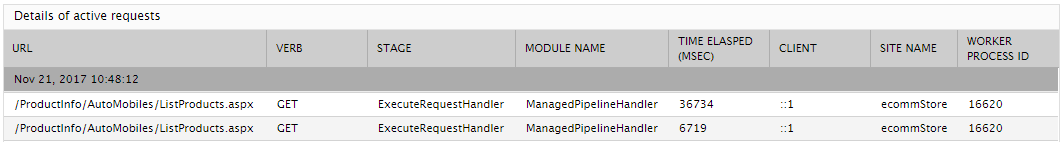
Figure 6 : Detailed diagnosis of the Requests being processed measure
The detailed diagnosis of the Slow requests measure lists the request URLs that were processed slowly by the web site. Since the list is sorted in the descending order of the Total Elapsed time - i.e., processing time - a quick look at the list will reveal to you the slowest request. The type of request (GET or POST), the stage, and module name are also displayed as part of the diagnostics to aid effective troubleshooting.
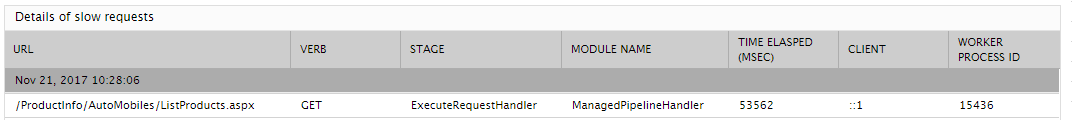
Figure 7 : The detailed diagnosis of the Slow requests measure