IIS Web Site Requests Test
One of the key indicators of the performance of a web site is user experience with that site. If a web site responds slowly to user requests, user experience with that site will be anything but pleasant. To ensure peak performance of the web sites on an IIS web server at all times, administrators should continuously track user requests to each web site, measure the responsiveness of the web site to the requests, identify the slow web sites, ascertain the reason for the slowness, and clear the bottleneck. This is where the IIS Web Site Requests test helps.
This test automatically discovers the web sites on an IIS web server and for each web site reports the request load on that web site and the count of requests that were processed slowly by the site. This way, the test pinpoints the slow web sites. Using the detailed diagnosis of the test, you can also identify the exact request URLs that are slow. This information helps administrators isolate and address the root-cause of the slowness .
Target of the test : An IIS web server
Agent deploying the test : An internal agent;
Outputs of the test : One set of results for every web site on the target IIS web server
|
| Measurement | Description | Measurement Unit | Interpretation |
|---|---|---|---|
|
Requests being processed |
Indicates the total number of requests to this web site that are currently being processed. |
Number |
This is a good indicator of the current workload of a web site. To view the details of active requests, use the detailed diagnosis of this measure. |
|
Slow requests |
Indicates the number of requests to this web site that are slow. |
Number |
Ideally, the value of this measure should be 0. A non-zero value denotes that one/more requests to this web site have violated the SLOW REQUEST CUT OFF configured for this test. Compare the value of this measure across web sites to know which web site is slow. To know which request URLs are processed slowly by a web site, use the detailed diagnosis of this measure. |
The detailed diagnosis of the Slow requests measure lists the request URLs that were processed slowly by the web site. Since the list is sorted in the descending order of the Total Elapsed time - i.e., processing time - a quick look at the list will reveal to you the slowest request. The type of request (GET or POST), the stage, and module name are also displayed as part of the diagnostics to aid effective troubleshooting.
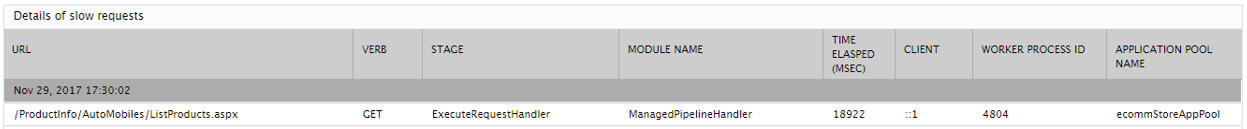
Figure 1 : The detailed diagnosis of the Slow requests measure
The detailed diagnosis of the Requests being processed measure reveals the details of the active requests to the web site. The request URL, the type of request (Verb), the stage, module name, the web site to which the request pertains, the worker process that processed the request, the client from which the request originated, and the time taken to process the request are reported as part of the detailed diagnostics. From this information, administrators can proactively detect a potential request processing bottleneck, and can initiate preventive measures immediately.
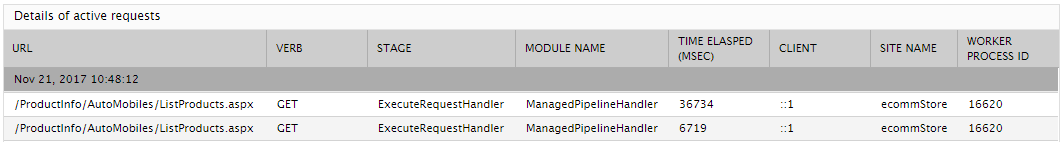
Figure 2 : Detailed diagnosis of the Requests being processed measure