IIS Web Sites Test
Typically, the Web Site Transactions test monitors only those web sites (on an IIS web server) for which transactions have been explicitly configured using the eG administrative interface. Therefore, if an IIS web server hosts multiple sites, and if transactions have been configured only for one of them, then the Web Site Transactions test will report statistics pertaining to that one site alone. Performance issues in other web sites, will hence go undetected and consequently, unresolved. Using this test, you can monitor each of the web sites hosted by an IIS web server, regardless of whether or not transactions have been configured for them.
Target of the test : A web site supported by a web server
Agent deploying the test : An internal agent;
Outputs of the test : One set of results for every web site monitored
|
| Measurement | description | Measurement Unit | Interpretation |
|---|---|---|---|
|
Availability: |
Indicates whether the web site is currently available or not. |
Percent |
The value 0 indicates that the website is not running, the value 100 indicates that it is up and running. |
|
Data receive rate: |
Indicates the rate at which the data is received by the web server. |
KBytes/Sec |
An increase in this value is indicative of an increase in user requests to the web server. |
|
Data transmit rate: |
Indicates the rate at which the data is transmitted by the web server. |
KBytes/Sec |
A large increase in the data transmission rate can be indicative of an increase in the popularity of one or more web sites hosted on the server. |
|
Connection rate: |
Indicates the rate of connections to the web server. |
Conns/Sec |
An increase or decrease in connection rate can represent a change in user workload. |
|
Current requests: |
Indicates the number of server threads/ processes that are currently in use for serving requests. |
Number |
If a majority of the server threads/processes are in use simultaneously, this may be indicative of a server bottleneck. |
|
Requests serviced rate: |
Indicates the rate at which all HTTP Requests are issued. |
Requests/Sec |
|
|
Current anonymous users: |
Indicates the number of users who currently have an anonymous connection. |
Number |
|
|
Current non-anonymous users: |
Indicates the number of users who currently have non-anonymous connection. |
Number |
|
|
Get requests: |
Indicates the rate at which HTTP requests using the GET method are made. |
Requests/Sec |
|
|
Post requests: |
Indicates the rate at which HTTP requests using the POST method are made. |
Requests/Sec |
|
|
Head requests: |
Indicates the rate at which HTTP requests using the HEAD method are issued. |
Requests/Sec |
|
|
Maximum connections: |
Indicates the maximum number of simultaneous connections established in the last measurement period. |
Number |
|
|
Not found requests: |
Indicates the rate of errors due to requests that could not be satisfied by the web server because the requested document could not found. |
Requests/Sec |
A high value indicates a number of missing/error pages. |
|
Requests serviced: |
Indicates the number of HTTP requests serviced, currently. |
Number |
|
|
Applications configured to this site |
Indicates the number of applications configured to this site. |
Number |
Use the detailed diagnosis of this measure to know which applications are configured to this site. |
|
Application pools assigned to this site |
Indicates the number of application pools assigned to this site. |
Number |
Use the detailed diagnosis of this measure to know which application pools are assigned to this site. |
The detailed diagnosis of the Applications configured to this site measure lists the applications that are configured to the monitored site and the application pool to which every application belongs.
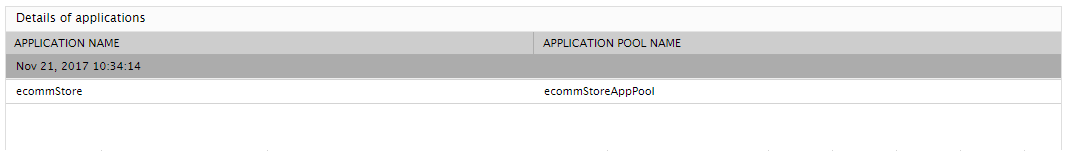
Figure 1 : Detailed diagnosis revealing applications configured to the monitored site
The detailed diagnosis of the Application pools assigned to this site measure reveals the application pools that are assigned to the monitored site and the status of each pool.
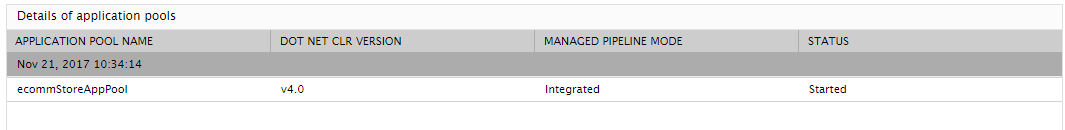
Figure 2 : Detailed diagnosis revealing the details of application pools assigned to the monitored site