Web Site Traffic Test
The Web Site Traffic test monitors the traffic to and from each of the web sites on IIS web servers, the errors that occurred during web site accesses, etc. This test reads the log files on the monitored IIS web servers to extract important metrics pertaining to the web site usage. These log files are created only if logging is explicity enabled on the monitored IIS/IIS SSL web server. To enable logging, do the following:
-
On the IIS web server host, open the Internet Information Services (IIS) Manager using the following sequence of steps: Start -> Settings -> Control Panel -> Administrative Tools -> Internet Information Services (IIS) Manager.
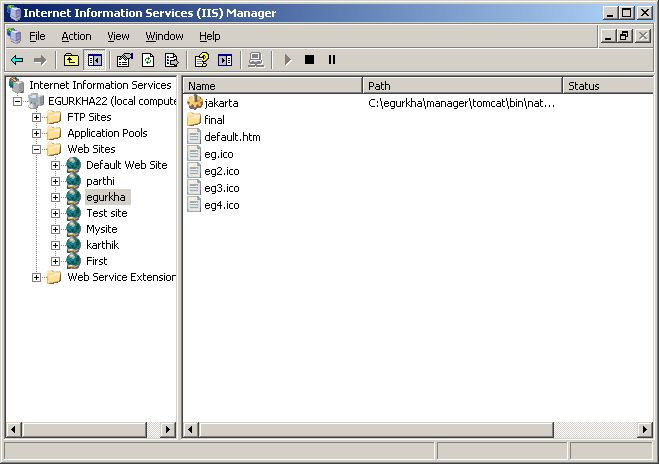
- In the tree-structure in the left pane of the console (see Figure 1), expand the node representing the local host, and then, the Web Sites node within; the complete list of web sites configured on the IIS web server will appear here.
-
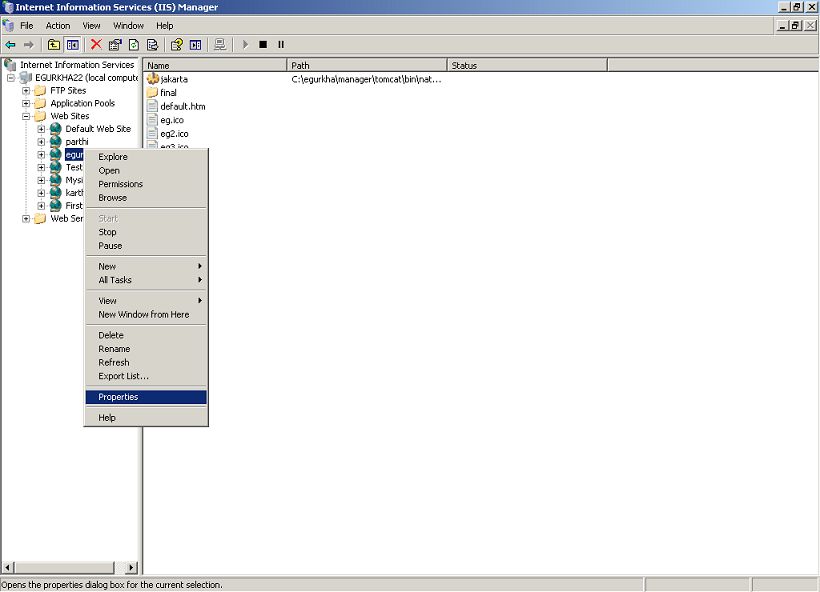
To enable logging for a particular web site, select that web-site from under the Web Sites node, right-click on it, and then, select the Properties option from the shortcut menu (see Figure 2).
-
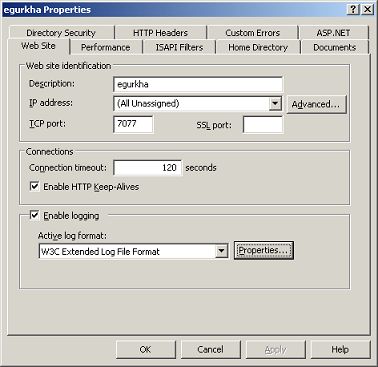
In the Web Site tab of the Properties dialog box that appears (see Figure 3), ensure that the Enable Logging check box is selected. Also, make sure that W3C Extented Log File Format is chosen as the Active log format.
-
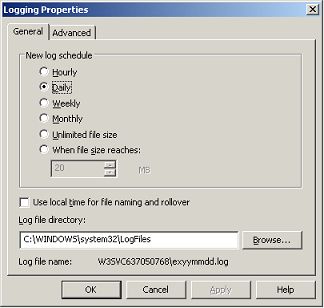
Next, click on the Properties button adjacent to the Active log format chosen. Figure 4 then appears, displaying the General settings of the W3C Extented Log File Format. In the Log file directory text box here, specify the directory to which the log file should be written; by default, C:\Windows\system32\LogFiles is displayed therein.
-
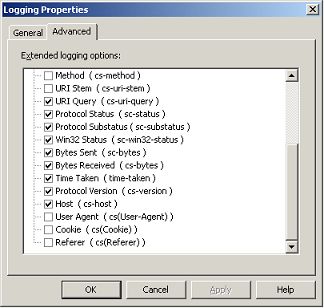
Click on the Advanced tab in Figure 4 to indicate the type of statistics to be logged into the log file. In Figure 5 that appears, ensure that the Win32 Status, Bytes Sent, and Bytes Received check boxes are selected.
- Finally, click the Apply and OK buttons to register the changes.
- Repeat this procedure for every web site to be monitored.
This test is disabled by default. To enable the test, go to the enable / disable tests page using the menu sequence : Agents -> Tests -> Enable/Disable, pick the desired Component type, set Performance as the Test type, choose the test from the disabled tests list, and click on the < button to move the test to the ENABLED TESTS list. Finally, click the Update button.
Target of the test : A web server instance
Agent deploying the test : An internal agent;
Outputs of the test : One set of results for every web site configured for monitoring on the target IIS web server
| Parameters | Description |
|---|---|
|
Test period |
How often should the test be executed |
|
Host |
The host for which the test is to be configured. |
|
Port |
The port at which the specified host listens to. |
|
LogFilePath |
Specify the full path to directory on the target IIS/IIS SSL web server that stores the log files; here, you need to specify the same directory that is provided in the Log file directory text box of Figure 4. |
| Measurement | Description | Measurement Unit | Interpretation |
|---|---|---|---|
|
Requests handled |
Indicates the number of requests currently received by this web site. |
Number |
|
|
Data transmitted (MB) |
Indicates the amount of data currently sent by this web site. |
MB |
A large increase in the data transmission can be indicative of an increase in the popularity of one or more web sites hosted on the server. |
|
Data received (MB) |
Indicates the amount of data currently received by this web site. |
MB |
An increase in this value is indicative of an increase in user requests to the server. |
|
200 responses |
Indicates the percentage of responses with the status code 200-299 during the last measurement period. |
Percent |
Typically, successful requests are indicated using the response code 200 - 299. |
|
300 responses |
Percentage of responses with a status code in the 300-399 range during the last measurement period. |
Percent |
300 responses could indicate page caching on the client browsers. Alternatively 300 responses could also indicate redirection of requests. A sudden change in this value could indicate a problem condition. |
|
400 errors: |
Percentage of responses with a status code in the range 400-499 during the last measurement period. |
Percent |
A high value indicates a number of missing/error pages. |
|
500 errors |
Percentage of responses with a status code in the range 500-599 during the last measurement period. |
Percent |
Since responses with a status code of 500-600 indicate server side processing errors, a high value reflects an error condition. |