Monitoring Informix Dynamic Servers
eG Enterprise presents an exclusive Informix monitoring model (see Figure 1) that consists of a set of hierarchical layers, each of which is associated with a wide variety of tests.
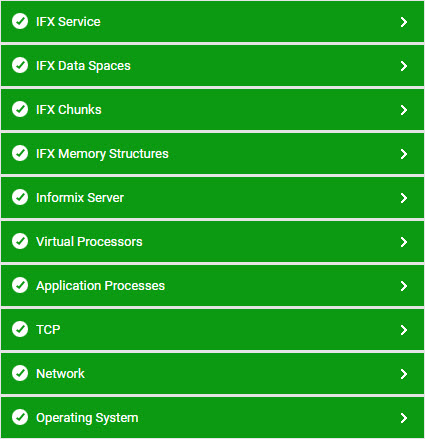
Figure 1 : The layer model of an Informix database server
These tests, which are configured to execute on the Informix server periodically, extract a wide range of performance statistics from the server. These statistics reveal the following:
- Is the Informix database server available? If so, how quickly does it respond to user requests?
- Is any virtual processor class consuming CPU resources excessively?
- Are buffers being effectively used while reading/writing data, or are direct disk reads and writes high?
- How well does the database manage locks? Are too many requests waiting for locks? Are there a large number of deadlocks?
- Do the logical logs have adequate free pages?
- Are any chunks on the Informix server in an offline or inconsistent state? If so, which are tehy?
- Is any chunk experiencing a space crunch?
- Is any dbspace running out of free space?
- Are users able to access data quickly? Are sorts on disk and memory performed frequently to ensure quick and easy access?
- Are there too many open sessions on the server? Who initiated the sessions, and how long have they been open?
- Are transaction rollbacks kept at a minimum?
- Have too many transactions been running for a long time?