Integrating with HP OpenView NNM v7.0
While integrating with HPOV NNM v 7.0 specifically, the following steps are necessary to ensure that NNM receives the SNMP traps sent by eG Enterprise:
- Copy the file eg_ov.conf from the eG manager directory (for e.g., /opt/egurkha/manager/config on Unix or <EG_HOME_DIR>\egurkha\manager\config on Windows environments) to the OpenView system.
-
On the OpenView system, run the command:
<OpenView_HOME_Dir>\NNM\bin\xnmevents -load <full path to eg_ov.conf>
Note:
When you run the above command, make sure that the NNM Event Configuration window (see Figure 170) is closed.
With that, the integration is complete. To verify whether the integration was successful or not, follow the steps below:
-
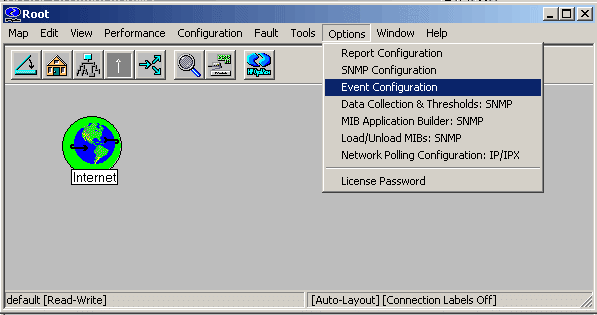
Using the Options -> Event Configuration menu items (see Figure 169) on the OpenView NNM Console, open the NNM Event Configuration window.
-
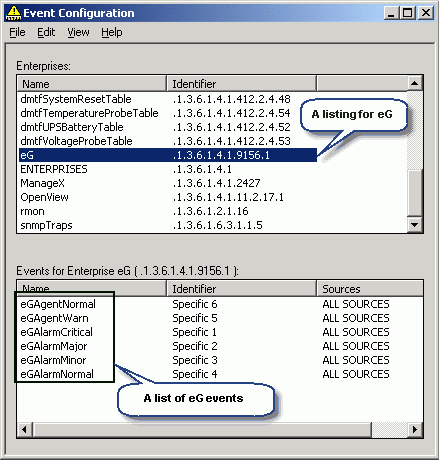
Under the Enterprises section, you should see a listing for eG (see Figure 170). Clicking on this listing, will display a list of eG events - since we had earlier configured the eG manager to send out SNMP traps for Critical, Major, Minor, and Normal events (see Figure 170), you will find an entry for each of these configured events (see Figure 170) in the events list. Also, note that the events list includes the following entries: eGAgentNormal and eGAgentWarning. These additional listings ensure that the SNMP console also displays alerts when an eG agent stops and starts later.
-
The above process also adds a new category called eG Alarms in the OpenView NNM alarm categories list (see Figure 171 and Figure 172). All eG events are automatically associated with this category. Clicking on any of the events listed in Figure 170 will lead you to the Modify Events dialog box (see Figure 171). In the Event Message tab page of the dialog box, you should see the eG Alarms category in the list of categories that appears on selecting the Log and display in category option. You will also see the new category in the Alarm Categories window depicted by Figure 172.
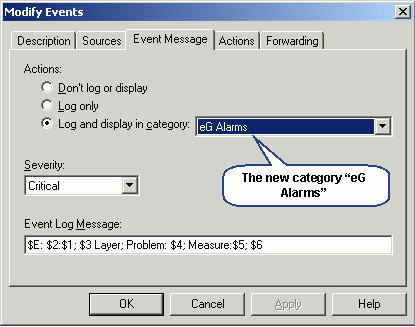
Figure 171 : The Event Message tab page of the window displaying a new category called eG Alarms
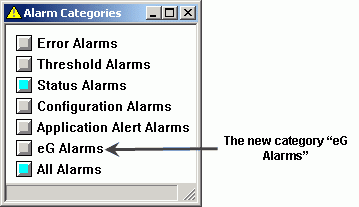
Figure 172 : The Alarm Categories window displaying the eG Alarms category
-
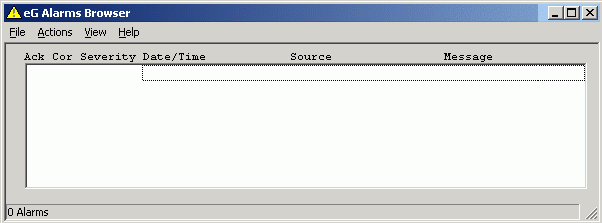
Stop the OpenView NNM alarm manager and then, start it using the command xnmevents. The Alarm Categories window (as depicted by Figure 172 above) will come up. Clicking on the eG Alarms option in this window will open the eG Alarms Browser, which displays the details of alarms sent by the eG manager. If there are no issues in the environment currently, then the browser will display no alarms (see Figure 173).
-
Once the eG manager detects performance issues, it will generate and display alarms in the Alarms window of the eG monitoring console. The Alarms window depicted by Figure 174 and Figure 175, for example, indicates that the MS FTP server in the environment has crashed, thereby bringing down the FTP publishing service!
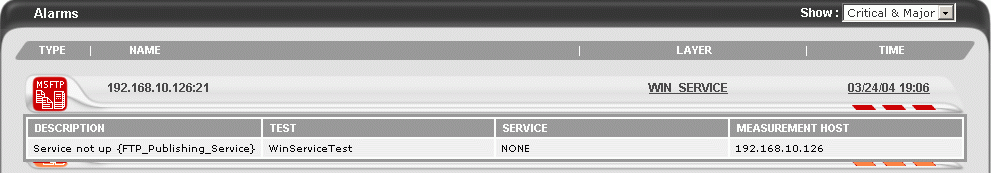
Figure 174 : The Critical alarm indicating the MS FTP service has gone down
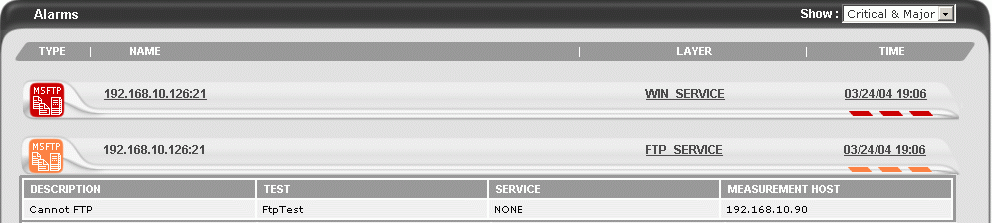
Figure 175 : A Major alarm indicating that the agent is unable to FTP files
-
When the eG manager generates alarms, the color-coding of the eG Alarms category in the Alarm Categories window of the NNM console, will change to reflect the severity of the eG alarm. In Figure 176, for instance, the color-coding of the eG Alarms category has changed to Red, indicating the existence of one/more Critical issues.
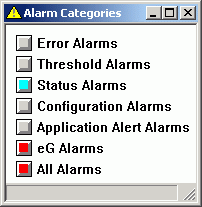
Figure 176 : The eG Alarms category indicating the existence of Critical alarms
-
Clicking on eG Alarms in Figure 176 will open Figure 177, where the details of the alerts raised by the eG manager will be displayed.
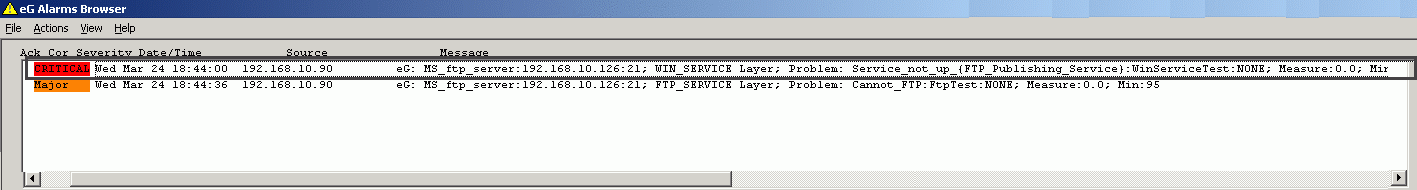
Figure 177 : The eG Alarms Browser displaying the details of the alarms generated by the eG manager
-
To understand the contents of these alerts better, let us take a closer look at say, the first alert reported by .
Contents of the SNMP alert The alarm severity
CRITICAL
The date/time of problem
Wed Mar 24 18:44:00
The IP address of the eG manager
192.168.10.90
The problem component-type
MS_ftp_server
The IP and TCP port of the problem component
192.168.10.126:21
The problem layer
WIN_SERVICE Layer
A brief description of the problem
Service_not_up (FTP_Publishing_Service)
The problem test
WinServiceTest
The value of the measure
0.0
The threshold value that was violated
Not visible in the figure
-
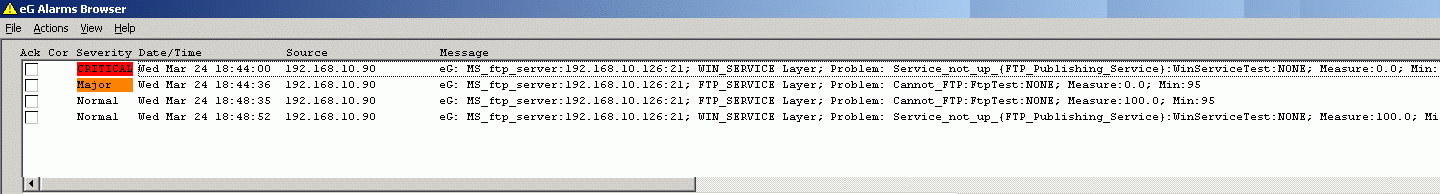
If a problem is resolved, and the problem component is restored to its Normal state, the eG manager will send out Normal alerts to the SNMP management console. Accordingly, the color-coding of the eG Alarms category in the NNM console will change once again, indicating the return to normalcy (see Figure 178). Moreover, the eG Alarms Browser will display the details of the Normal alerts as well (see Figure 179.
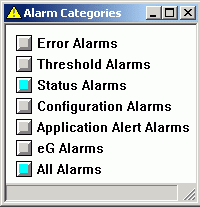
Figure 178 : The eG Alarms category in a Normal state
- In addition to tracking changes in the state of eG-managed components, this integration also enables you to track changes in the state of eG agents deployed in an environment, from a single monitoring console. If an eG agent suddenly stops, and comes back up later, you will find equivalent alerts displayed in the eG Alarms Browser of the NNM console (see Figure 180). From Figure 180, it is evident that while a Warning event was raised for the eG agent failure, a Normal event was raised when the agent started running subsequently.
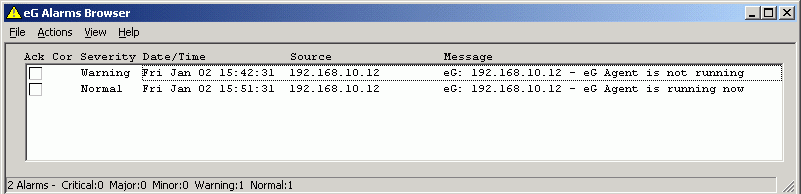
Figure 180 : The eG Alarms browser indicating agent state changes