
Web Service Test
A web service is a collection of open protocols and standards used for exchanging data between applications or systems. Software applications written in various programming languages and running on various platforms can use web services to exchange data over computer networks like the Internet in a manner similar to inter-process communication on a single computer. A complete web service is, therefore, any service that:
- Is available over the Internet or private (intranet) networks
- Uses a standardized XML messaging system
- Is not tied to any one operating system or programming language
- Is self-describing via a common XML grammar
- Is discoverable via a simple find mechanism
The basic web services platform is XML + HTTP. All the standard web services work using the following components:
- SOAP (Simple Object Access Protocol)
- UDDI (Universal Description, Discovery and Integration)
- WSDL (Web Services Description Language)
A web service enables communication among various applications by using open standards such as HTML, XML, WSDL, and SOAP. A web service takes the help of the following:
- XML to tag the data
- SOAP to transfer a message
- WSDL to describe the availability of service.
The following are the major uses of the Web Services:
- Reusable application-components: Often applications need repeated access to application-components like currency conversion, weather reports, or even language translation. In such cases, the web services can be used to offer the application-components as services with ease.
- Connect existing software: Web services can help to solve the interoperability problem by giving different applications a way to link their data. With Web services you can exchange data between different applications and different platforms. Any application can have a Web Service component. Web Services can be created regardless of programming language.
In certain environments, administrators are required to keep an eye on the web services that offer repeated access to the application-components i.e., operations so that the work load on the users using those application components can be minimized. If for some reason the web service takes too long to respond or is unavailable to cater to the needs of the users, then the users will be deprived of access to the application-components involved in that particular web service. To avoid such inconvenience caused to the users, administrators are required to continuously monitor the web services. The Web Service test helps administrators to perform this task perfectly. By continuously monitoring each operation i.e., application component of a web service that is offered, using the SOAP commands, this test helps administrators identify the availability, response time and response code of the web service and quickly figure out discrepancies if any web service is deemed unavailable. This way, the web services can be kept available round the clock thus helping the users perform their tasks without any difficulty.
Target of the test : A JBoss AS/EAP server
Agent deploying the test : An internal agent
Outputs of the test : One set of results for each WebService:Operation i.e., application-component performed on the target server that is being monitored.
|
| Measurement | Description | Measurement Unit | Interpretation | ||||||
|---|---|---|---|---|---|---|---|---|---|
|
WSDL url availability: |
Indicates whether the web service was able to respond successfully to the query made by the test. |
Percent |
Availability failures could be caused by several factors such as the web service process(es) being down, the web service being misconfigured, a network failure, etc. Temporary unavailability may also occur if the web service is overloaded. Availability is determined based on the response code returned by the service. A response code between 200 to 300 indicates that the service is available. |
||||||
|
WSDL response time: |
Indicates the time taken by the eG agent to get the configured web service. |
Secs |
Response time being high denotes a problem. Poor response times may be due to the service being overloaded or misconfigured. If the URL accessed involves the generation of dynamic content by the service, backend problems (e.g., an overload at the application server or a database failure) can also result in an increase in response time. |
||||||
|
Port status: |
Indicates whether/not the port of the web server is reachable. |
|
The values reported by this measure and the corresponding numeric equivalents are listed in the table below:
Note: By default, this measure reports the above-mentioned Measure Values to indicate whether the server has been rebooted or not. In the graph of this measure however, the Measure Values are represented using the numeric equivalents only. |
||||||
|
TCP connection availability: |
Indicates whether the test managed to establish a TCP connection to the server. |
Percent |
Failure to establish a TCP connection may imply that either the web server process is not up, or that the process is not operating correctly. In some cases of extreme overload, the failure to establish a TCP connection may be a transient condition. As the load subsides, the server may start functioning properly again. |
||||||
|
TCP connect time: |
This measure quantifies the time for establishing a TCP connection to the web server host. |
Secs |
Typically, the TCP connection establishment must be very small (of the order of a few milliseconds). Since TCP connection establishment is handled at the OS-level, rather than by the application, an increase in this value signifies a system-level bottleneck on the host that supports the web server. |
||||||
|
Server response time: |
Indicates the time period between when the connection was established and when the web server sent back a response header to the client. |
Secs |
While the total response time may depend on several factors, this measure is typically, a very good indicator of a server bottleneck (e.g., because all the available server threads or processes are in use). |
||||||
|
Response code: |
The response code returned by the web server for the simulated request. |
Number |
A value between 200 and 300 indicates a good response. A 4xx value indicates a problem with the requested content (eg., page not found). A 5xx value indicates a server error. |
||||||
|
Service availability: |
Indicates whether/not the web service is available. |
Percent |
A value of 100 indicates that the web service is available and a value of 0 indicates that the web service is not available. |
||||||
|
Operation status: |
Indicates whether/not the configured operation is present in the web service. |
|
This measure will not report metrics if the OPERATION parameter in the test configuration page is none in the test configuration page. |
||||||
|
Operation Content length: |
Indicates the response code returned by the server for the simulated request. |
Number |
A value between 200 and 300 indicates a good response. A 4xx value indicates a problem with the requested content (e.g., page not found). A 5xx value indicates a server error. This measure will not report metrics if the OPERATION parameter in the test configuration page is none or if an invalid Value is specified or if the Value is not specified in the HTML View tab while configuring the operation for monitoring in the test configuration page. |
||||||
|
Operation Content validity: |
This measure validates whether the operation was successful in executing the request made to it. |
Percent |
A value of 100% indicates that the content returned by the test is valid. A value of 0% indicates that the content may not be valid. This capability for content validation is especially important for multi-tier web applications. For example, a user may not be able to login to the web site but the server may reply back with a valid HTML page where in the error message, say, “Invalid Login” is reported. In this case, the availability will be 100 % (since we got a valid HTML response). If the test is configured such that the content parameter should exclude the string “Invalid Login”, in the above scenario content validity would have a value 0. This measure will not report metrics if the OPERATION parameter in the test configuration page is none or if an invalid Value is specified or if the Value is not specified in the HTML View tab while configuring the operation for monitoring in the test configuration page. |
||||||
|
Operation execution time: |
Indicates the time taken to invoke the configured operation in the web service. |
Secs |
This measure will not report metrics if the OPERATION parameter in the test configuration page is none or if an invalid Value is specified or if the Value is not specified in the HTML View tab while configuring the operation for monitoring in the test configuration page. |
Configuring Multiple WSDL URLs for Monitoring
In order to enable the eG agent to connect to multiple WSDL URLs and pull out the required metrics from them, the eG administrative interface provides a special page using which different WSDL URLs and their corresponding operations that need to be monitored can be specified. To configure the WSDL URLs, do the following:
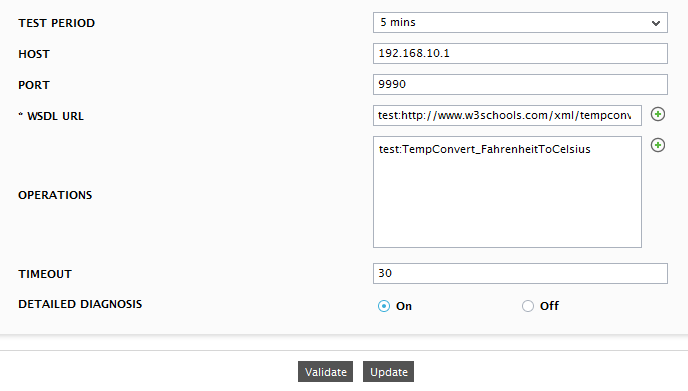
Figure 1 : Configuring the WebService test
-
Click on the encircled ‘+’ button alongside the WSDL URL text box. will then appear.
-
Specify the following in Figure 2:
- Name: Specify a unique name by which the WSDL URL you will be specifiying shortly will be referred to across the eG user interface. This is the name that will appear as the descriptor of this test.
- URL: Enter the WSDL URL of the web service that this test should access.
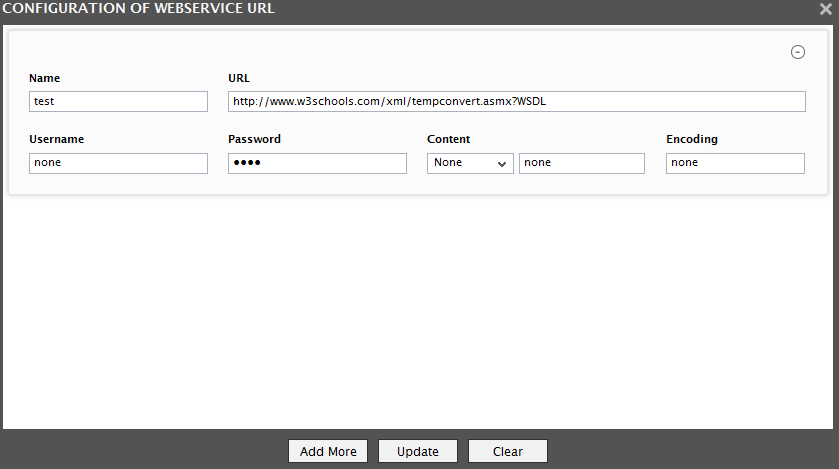
-
Username and Password: These parameters are to be set only if a specific user name / password has to be specified to login to the web service (i.e., WSDL URL ) that you have configured for monitoring. In this case, provide valid login credentials using the Username and Password text boxes. If the server on which WebService test executes supports ‘Anonymous user access’, then these parameters will take either of the following values:
- A valid Username and Password for the configured WSDL URL
- none in both the Username and Password text boxes of the configured WSDL URL, if no user authorization is required
- Some servers however, support NTLM (Integrated Windows) authentication, where valid login credentials are mandatory. In other words, a none specification will not be supported by such servers. Therefore, in this case, against each configured WSDL URL, you will have to provide a valid Username in the format: domainname\username, followed by a valid Password.
- Please be sure to check if your web service requires HTTP authentication while configuring this parameter. HTTP authentication typically involves a separate pop-up window when you try to access the page. Many services use HTTP POST for obtaining the user name and password and validating the user login. In such cases, the username and password have to be provided as part of the POST information and NOT as part of the CREDENTIALS specification for the WebService test.
- Content : The Content parameter has to be configured with an instruction:value pair that will be used to validate the content being returned by the test. If the Content value is None, no validation is performed. On the other hand, if you pick the Include option from the Content list, it indicates to the test that for the content returned by the web server to be valid, the content must include the specified value (a simple string search is done in this case). This value should be specified in the adjacent text box. Similarly, if the Exclude option is chosen from the Content drop-down, it indicates to the test that the server's output is valid if it does not contain the value specified in the adjacent text box. The Include or Exclude value you specify in the text box can include wildcard characters. For example, an Include instruction can be *Home page*.
- Encoding: Sometimes the eG agent has to parse the WSDL URL content with specific encoding other than the default (ISO-8859-1) encoding. In such a case, specify the type of encoding using which the eG agent can parse the WSDL URL content in the Encoding text box. By default, this value is none.
- Similarly, you can add multiple URL specifications by clicking the Add More button. To remove a WSDL URL specification, click on the encircled ‘-’ button corresponding to it. To clear all WSDL URL specifications, click the Clear button. To update all the changes you made, click the Update button.
- Once Update is clicked, you will return to the test configuration page as shown in Figure 1. The WSDL URL text box in the test configuration page will display just the Names - i.e., the unique display names - that you may have configured for the multiple WSDL URLs, as a comma-separated list. To view the complete WSDL URL specification, click the encircled ‘+’ button alongside the WSDL URL text box, once again.
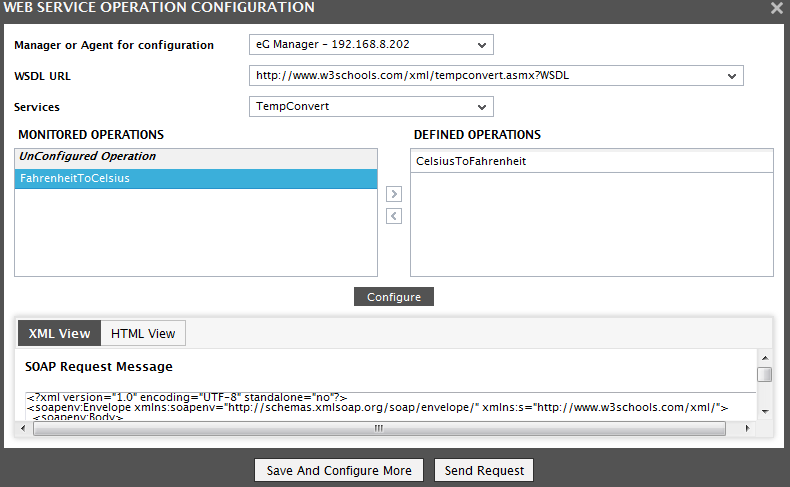
Configuring Multiple Operations for Monitoring - WebServiceTest
By default, the WebServiceTest will be configured with the WSDL URLs that offer the web services that are to be monitored. To configure the operations that are offered by the WSDL URLs, do the following:
-
Click on the encircled ‘+’ button alongside the OPERATIONS text box as shown in Figure 1. Figure 3 will then appear.
-
Specify the following in Figure 3:
- Manager/Agent for accessing WSDL URL: Select the eG agent or the eG Manager that is authorized to access the configured WSDL URL from this list.
- WSDL URL: Once the eG agent/eG Manager is chosen from the Manager/Agent for accessing WSDL URL list, this list will be populated automatically with all the WSDL URLs specified in the WSDL URL text box (See Figure 1). Select the WSDL URL of your choice from this list.
-
Services: The web services offered by the chosen WSDL URL will then be populated in this list. Select a service of your choice from this list.
- The operations that are offered by the chosen service will then be populated in the DEFINED OPERATIONS list. To monitor a chosen operation, select the operation and click the < button. This will move the chosen operation to the MONITORED OPERATIONS list.
- Click the Configure button to save the changes.
- The eG agent uses SOAP requests to obtain the necessary metrics from the web service. Once the operation is configured, the XML View of the SOAP Request corresponding to the chosen operation will be generated and listed in the XML View tab. Likewise, the HTML View tab lists the SOAP Parameter that is passed to collect the required metrics for the chosen operation.
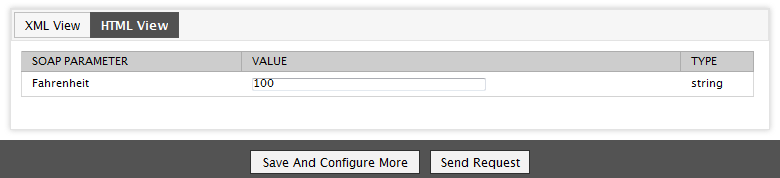
-
To obtain operation-level statistics, it is important to specify a valid value in the VALUE text box of the HTML View tab as shown in Figure 4. Each time the test is executed, this value will be provided as an input to the chosen operation.
- Click the Save and Cofigure More button to save the changes made.
-
If you wish to verify if the VALUE specified in the HTML View tab is valid, then you can do so by clicking the Send Request button. Figure 5 will then appear. If the value specified in the VALUE text box is indeed valid, then the operation will be performed on the value and the result will be specified. For example, if your chosen operation is FahrenheittoCelsius, the SOAP Parameter is Farenheit and the value that you wish to convert is 100, the result will be specified in the WEB SERVICE RESPONSE pop up window as below:
<FahrenheitToCelsiusResult>37.7777777777778</FahrenheitToCelsiusResult>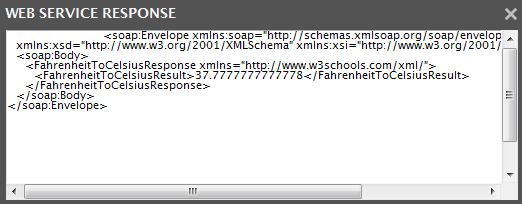
Figure 5 : The value that appears when the operation is performed successfully
If you have specified an invalid value, then a message as follows will be displayed in the pop up window:
<FahrenheitToCelsiusResult>Error</FahrenheitToCelsiusResult>
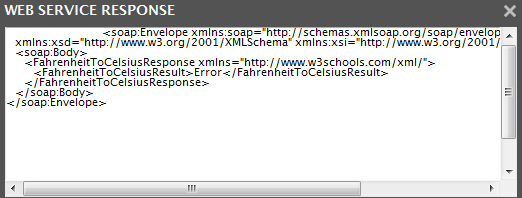
Figure 6 : An Error appearing during value conversion
If you do not specify a VALUE or specify an invalid value, operation-level statistics will not be collected by the eG agent and such metrics will not be available in the eG monitoring interface.
- Similarly, you can configure multiple Operations by clicking the Configure button in Figure 3. To remove an operation, select the operation from the MONITORED OPERATION list and click the > button.
- Once Save and Configure More button is clicked, you will return to the test configuration page (see Figure 1). The OPERATIONS text box in the test configuration page will display just the operations, as a comma-separated list. To view the complete operation specification, click the encircled ‘+’ button alongside the OPERATIONS text box, once again.
