Monitoring JBoss Application Servers
Once the components are deployed on the JBoss server, the eG agent periodically executes tests on the server to capture the statistics collected by the components, and reports them to the eG manager. These tests are mapped to specific layers of the JBoss application server's layer model (see Figure 1).
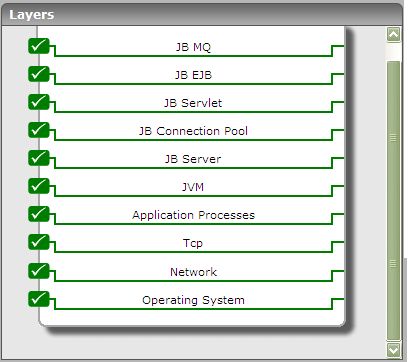
Figure 1 : The layer model of a JBoss application server
Note:
The JBoss monitoring model provided by eG Enterprise (see Figure 1) can be used to monitor a JBoss server (versions 4.0 and 4.2.3), in an agent-based or an agentless manner.
The measures reported by the tests enable JBoss administrators to make accurate performance judgments with respect to the following:
|
JVM heap monitoring |
|
|
Request processing capability Monitoring |
|
|
Thread pool monitoring |
|
|
Connection pool monitoring |
|
|
Servlet monitoring |
|
|
EJB monitoring |
|
|
Messaging service monitoring |
|
|
Topic monitoring |
|
The sections to come will indulge in an elaborate discussion of the top 6 layers of the layer model depicted by Figure 1. As the other layers have been dealt with in great detail in the Monitoring Unix and Windows Servers document.