Monitoring JEUS Web Application Server
eG Enterprise offers a specialized JEUS monitoring model (see Figure 1) that uses JMX (Java Management extension), the new standard for managing java components, for monitoring version JEUS Web Application Server. JMX allows users to instrument their applications and control or monitor them using a management console.
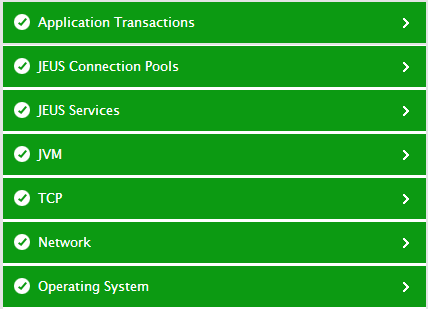
Figure 1 : The layer model of JEUS Web Application Server
Every layer of Figure 1 above is mapped to a variety of tests; each of these tests can be configured to use agent-based or agentless methodologies to report the availability of the JEUS Web Application Server and the health of key components such as the EJBs, connection pools, thread pools, queues, topics and the JVM. Using the critical metrics reported by these tests, administrators can figure out the answers to the following questions related to performance of the JEUS Web Application Server:
- Is the server instance on the JEUS Web Application Server running?
- How well the connections on the connection pools were used?
- How many free connections are available for use in each connection pool?
- Are there too many threads waiting to be serviced?
- How well the queues processed and delivered the messages?
- How well the topics processed and delivered the messages?
- What is the status of each application deployed on the target server?
- What is the rate at which the requests of each application were processed successfully?
- How many EJBs were created/removed in a stateless session?
- How many EJBs were created/removed in a stateful session?