Monitoring JRun Application Servers
eG Enterprise presents a hierarchical JRun monitoring model (see Figure 1), which executes diagnostic tests on the JRun server to extract a wide variety of performance heuristics. Using these statistics, administrators can guage the following:
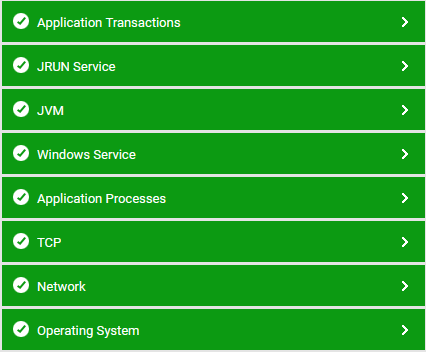
Figure 1 : Layer model for a JRun application server
Each layer of the layer model is mapped to a series of tests that reports a wealth of performance metrics related to the appliance. These metrics can provide accurate answers for the following performance queries:
- Does the JRun server have adequate threads for handling its current and anticipated workload? Are too many requests waiting for threads?
- Is the server able to process requests quickly?
- Are there any requests for which processing has been delayed significantly?
- Have any requests been dropped by the server?
- Are too many requests awaiting processing?
- How quickly does the server respond to a request?
- Has sufficient memory been allocated to the server to serve requests effectively?
- Is the user activity on the server unusually high?