Detailed Diagnostics Revealing that a Slow JVM Node is Causing Transactions to Slowdown
Let us consider the example of a web application, where the following transactions are slow.
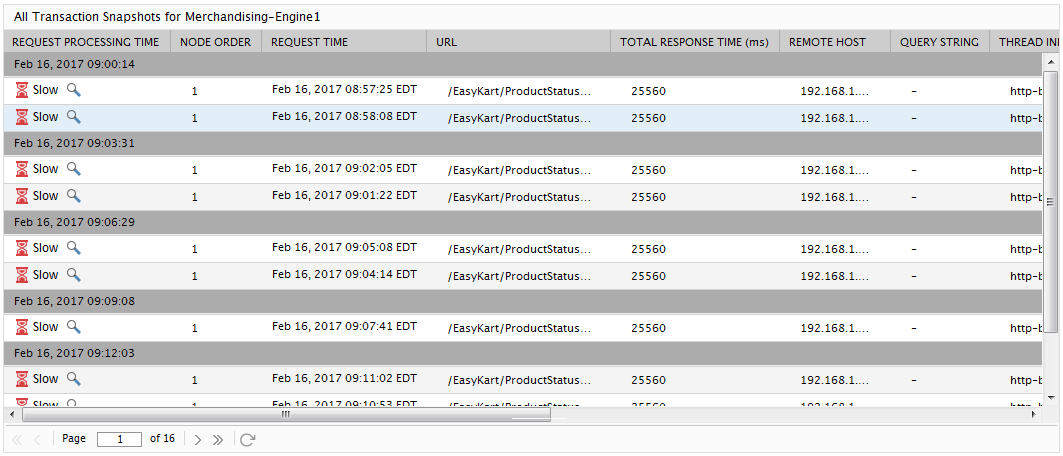
Figure 1 : Detailed diagnosis of the Avg response time measure
Let us focus on the slow /Easykart/ProductStatus.jsp in Figure 1. To zoom into the transaction, click on it. The flow of the ProductStatus.jsp transaction will then be displayed as depicted by Figure 2.
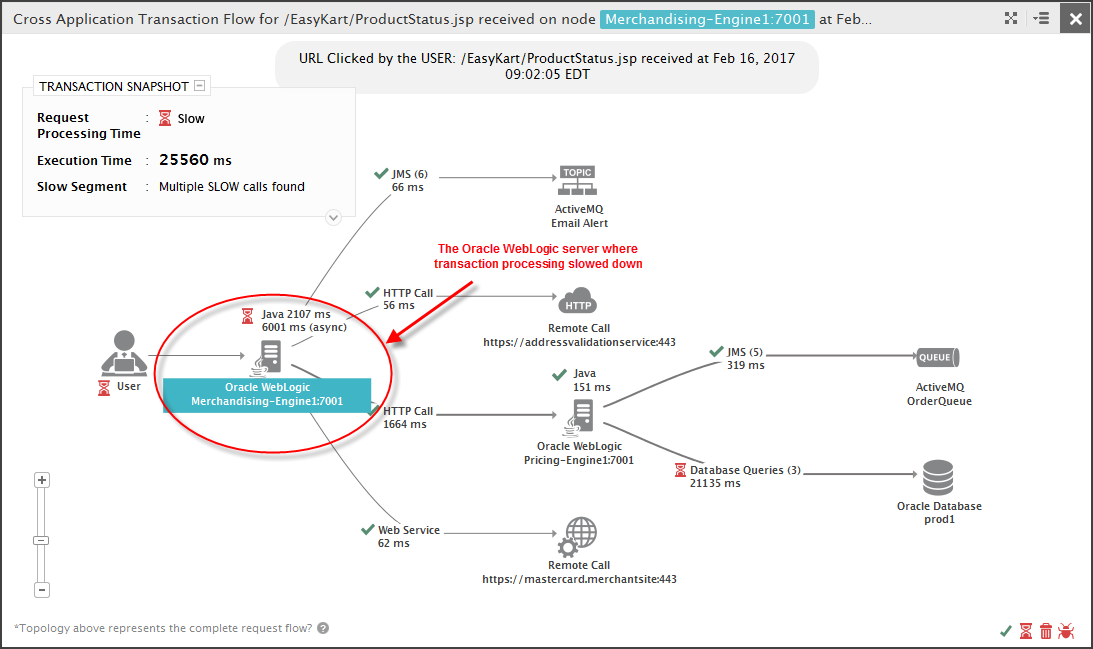
Figure 2 : The cross-application flow of the ProductStatus.jsp transaction
From the transaction flow, it is evident that the transaction slowed down on the Oracle WebLogic server, Merchandising-Engine1:7001. The question now is what type of processing on the Oracle WebLogic server delayed the transaction in question. A closer look at the WebLogic server icon in Figure 2 will answer this question as well! As indicated by Figure 2, the Merchandising-Engine1:7001 server processed Java methods synchronously for 2107 milliseconds and asynchronously for over 6000 milliseconds. Comparing the two execution times points the needle of suspicion towards the synchronous Java call made by the WebLogic server. If so, which exact Java method is slowing down the transaction? To identify the same, let us zoom into the WebLogic server by clicking on it in Figure 2. An intermediate window depicted by Figure 3 will then appear.
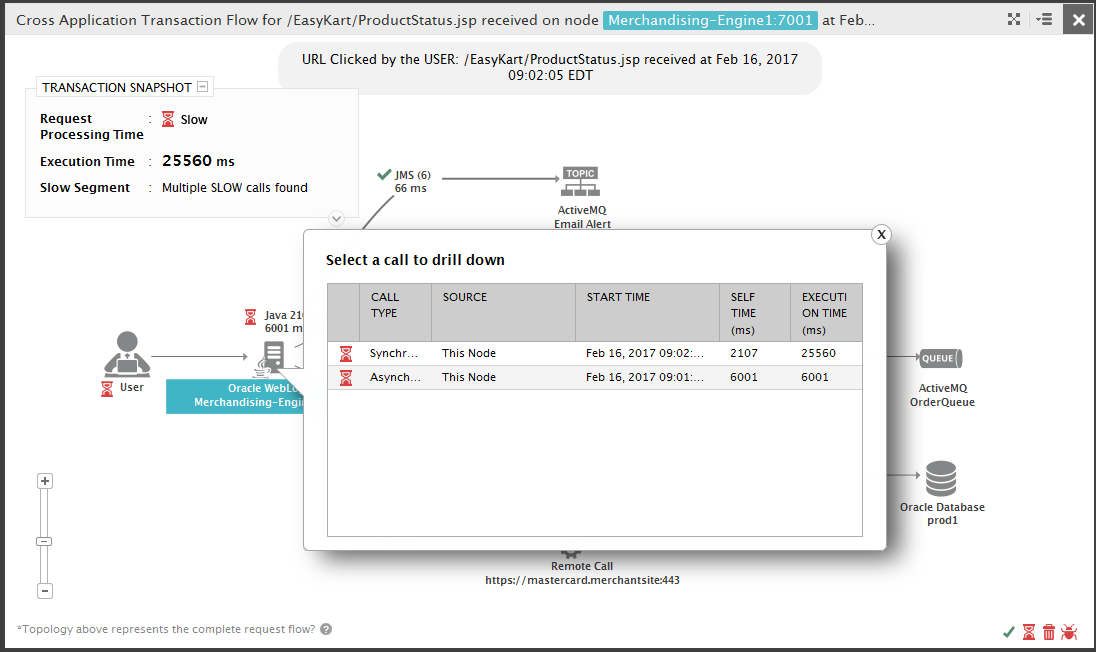
Figure 3 : An intermediate modular window
This intermediate window will appear only under the following circumstances:
- If a node receives and processes multiple synchronous / asynchronous requests from one/more external sources; and/or
- If one/more asynchronous threads are invoked by a node in response to requests to it;
Typically, from this window, you will be able to quickly determine the number of synchronous and asynchronous calls that a particular JVM node processed. In the case of our example, we can clearly infer from the intermediate window that the Merchandising-Engine1:7001 server executed a synchronous and an asynchronous call.
For each synchronous and asynchronous call, this window will also display the self execution time and total execution time of that call. Self execution time is the time it took for the synchronous/asynchronous call to perform Java processing alone. Total execution time is the time taken by the synchronous/asynchronous call to perform both Java and non-Java (eg., HTTP, Database, etc.) processing. By comparing the self and total execution times across calls, you will be able to accurately identify the exact call that took too long to execute, the call type, and whether such a call was slow in processing Java or non-Java. Accordingly, we can clearly deduce from the intermediate window of Figure 3 that the synchronous call made by Merchandising-Engine1:7001 server in our example performed Java processing for a much longer time than desired. To be able to precisely identify the exact Java method that caused the delay, click on the synchronous call in Figure 3. Figure 4 will then appear.
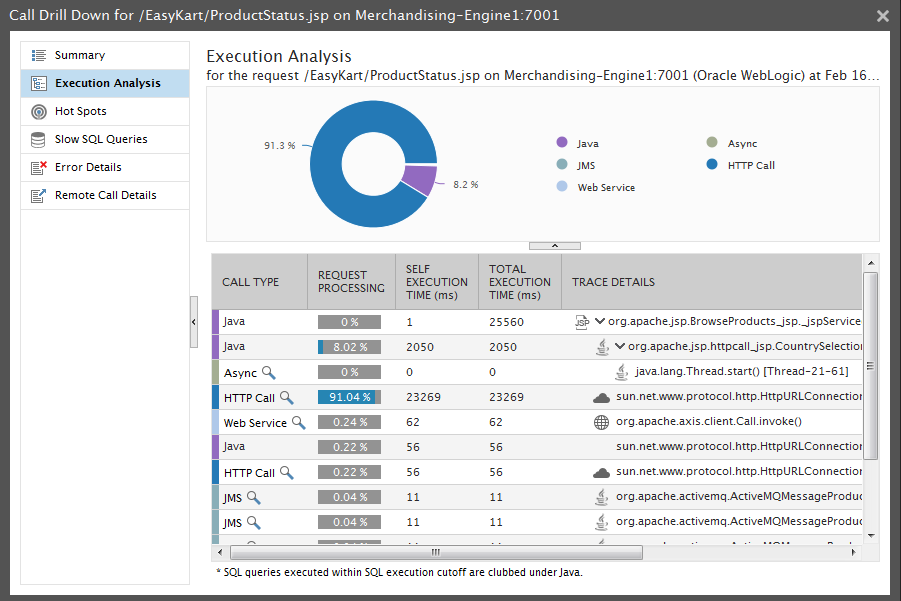
Figure 4 : The call graph of the synchronous call
Figure 4 provides a detailed Execution Analysis of the synchronous call. As part of this analysis, a pie chart is presented that quickly reveals the percentage of time the WebLogic server in our example spent processing the server’s Java code and making external JMS / SAP JCO / SQL query calls. The table below the pie chart in Figure 4 lists the exact methods that performed Java processing or made the remote calls. A quick look at this table reveals that the Java method, org.apache.jsp.BrowseProducts_jsp_jspService..., invoked a series of child methods and external calls, which together took over 25000 milliseconds to execute. However, the method itself took only around 1 millisecond to execute (self execution time)! Browsing the child methods called by the parent method reveals that the transaction spent over 90% of its time on the HTTP call, 'sun.net.www.protocol..'. This means that the 'sun.net.www.protocol..' is the method that is delaying the BrowseProducts.jsp transaction. To know the exact URL that this HTTP call hit, move your mouse pointer over the call in Figure 4.
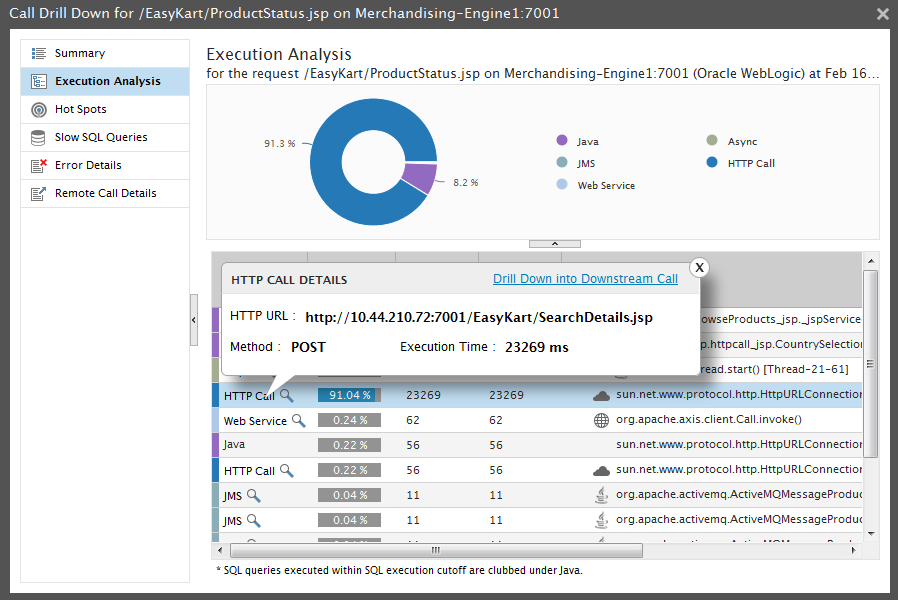
Figure 5 : The URL hit by an HTTP call
Figure 5 will then appear revealing that the /EasyKart/SearchDetails.jsp was the URL that was hit by the HTTP call.
This way, eG BTM enables you to diagnose the root-cause of slowness in your synchronous and asynchronous calls using just a few mouse clicks!