Detailed Diagnostics Revealing that an Inefficient Database Query is the Reason for a Slow Transaction
Let us consider the example of a web application that has been deployed on the Oracle WebLogic server, Address-Validation-Service1:7001. Users of the web application complained that every time they tried to browse the LanguageService web page on the web application, the response was very poor. Using eG’s Java Business Transactions test of the Oracle WebLogic server,Address-Validation-Service1:7001, you can promptly capture this anomaly! As you can see in Figure 1 below, the Java Business Transactions test has accurately captured and reported that the Slow transactions percentage for the /cms/LanguageService.jsp is 100%. This means that 100% of the requests for the LanguageService.jsp transaction were serviced slowly (see Figure 1)!
![]()
Figure 1 : The Layers tab page indicating that all requests for /Easykart/PaymentPage.jsp were slow
To know which request received the slowest response, click the diagnosis icon against the Slow transactions percentage measure in . Figure 2 will then appear listing all the transaction requests that were slow, the time at which each request was sent, the total response time of every request, the client from which the request was received, the query string of the transaction URL, and more.
![]()
Figure 2 : Detailed Diagnosis of the Slow transactions percentage measure
Since the requests are arranged in the descending order of their response time, a quick look at the detailed diagnostics will lead you to the precise request that is the slowest. But, why is response to this request slow? To answer this question, click the ‘magnifying glass’ icon against Slow in n the slowest request (i.e., the topmost request in Figure 2).
Figure 3 will then appear revealing the cross-application flow of the slow transaction. This flow diagram clearly reveals the following:
- The JVMs and backends through which the transaction travelled;
- The time for which the transaction request was processed at each BTM-enabled JVM; note that this time will not be computed for JVMs that are in the transaction path, but are not BTM-enabled and those that are BTM-enabled but are not managed by eG;
-
The exit calls made by each BTM-enabled node to another node as part of the transaction's journey, the time consumed by each exit call,and the number of times each type of call was made; the following exit calls are supported by eG BTM:
- Database Query
- HTTP
- Web service
- JMS
- LDAP
- RMI
- Java mail API
- EJB
- JSF (Java Server Faces)
- Runtime
Note that the EJB exit call is supported only for JBoss, WebLogic, and WebSphere nodes.
![]()
Figure 3 : Cross-application transaction flow
Note:
-
If a BTM-enabled node appears 'grayed out' in the cross-application transaction flow, it denotes that eG BTM could not collect detailed diagnostics for that node. The reasons for this could be either or both of the following:
- Transaction responsiveness on the 'grayed out' node was either healthy or was only slightly slow, and hence, did not appear in the list of Top-N slow transactions.
- Slow data transmission from eG agent to manager;
- If a JVM node makes a JMS call to a messaging server, then. in the transaction topology, that messaging server will be identified by the name of the messaging service provider and the name of the exact queue/topic that is managing the JMS request. If a JVM node makes a SQL query call on a database server, then the details displayed for that database server in the transaction topology depends upon whether/not that database server is managed by eG Enterprise. If the database server is not managed by eG Enterprise, then such a database server will be represented in the topology using the server type (whether Oracle, Microsoft SQL etc.) and the name of the database that was accessed by the SQL query. To know the IP and port number of the unmanaged database server, you can drill-down from the Database queries call in the topology. On the other hand, if the database server in question is being monitored by eG Enterprise, then such a server will be represented in the topology using the server type, nick name, port number, and the database name. Additionally, the SID will be displayed in case of an Oracle database server, and the instance name will be displayed in case of an instance-based Microsoft SQL server.
- EJB calls from a client and to a server on the same host will not be captured by eG BTM, and will hence not be displayed in the cross-application transaction topology.
-
Sometimes, empty nodes – i.e., nodes without any details – will be visible in the cross-application transaction flow topology. Likewise, the time spent on certain external calls may also not be displayed in the topology. This is owing to inconsistencies in the collection of detailed diagnostics.
Using conventional color codes and intuitive icons, the transaction flow chart precisely pinpoints where the transaction slowed down. In the case of Figure 3 above, from the color-coding it is clear that the Database Query executed by the Oracle WebLogic server – Address-Validation-Service1:7001 - is taking a long time for execution. The question now is which query is this. To determine that, click on Database Query in Figure 3.
Drilling down from Database Query in Figure 3 automatically opens the list of SQL Queries executed by the slow transaction in question (see Figure 4). The execution time of each query and what percentage of the total response time of the transaction each query is consuming will be displayed here. From Figure 4, it is evident that a select DISTINCT specials. . . query is taking over 19000 milliseconds for execution – this is apparently 97% of the total response time of the target transaction. This time-consuming query is what is causing the transaction to slow down. To view the complete query, click on that query in the SQL Queries list of Figure 4. The detailed query will then be displayed in the Query section of Figure 4.
![]()
Figure 4 : Analyzing the slow query
This way, using a short sequence of mouse clicks, you have zeroed-in on the source of the transaction slowness.
The transaction snapshot section in Figure 3 leads you to the same root-cause, without requiring any clicks! The details provided by this section are as follows:
- User Experience: The user experience with the LanguageService transaction; in our example, this is Slow
- Execution Time: The total response time of the LanguageServicetransaction;
- Slow Segment: Where exactly the LanguageService transaction slowed down;
From the Slow Segment display, it is evident that a database query executed by the LanguageService.jsp transaction on the Customers-DB database took over 19000 millisecs for execution, thereby slowing down the entire transaction! This corroborates our findings from the cross-application transaction flow and the subsequent query analysis.
Now, click on the down-arrow button at the bottom tip of the transaction snapshot section (as indicated by Figure 3). Doing so will reveal a tier-wise breakup of the transaction response time (see Figure 5). This way, you can quickly compare response time across tiers, and accurately isolate where the bottleneck lies – in this case, it is in the database queries.
![]()
Figure 5 : Tier-wise response time breakup
To close the tier-wise breakup, click on the up arrow button indicated by Figure 5.
You can even close the transaction snapshot pop-up if you want to by clicking on the  button alongside the title transaction snapshot (as indicated by Figure 5).
Let us now revisit the cross-application flow diagram of the LanguageService transaction. You can use the top-down slider at the bottom, left corner of the flow diagram (as indicated by Figure 3) to zoom your diagram in and out.
Moreover, by default, the time spent by the transaction at every point cut is reported in milliseconds in the flow diagram. You can reconfigure the flow diagram to express the time spent as a percentage of total transaction response time instead. For this, first click the button at the right, top corner of the flow diagram. The options depicted by Figure 6 will then appear.
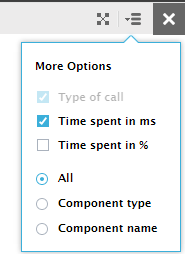
Figure 6 : Expressing the time spent at every point cut as a percentage of total transaction response time
Uncheck the Time spent in ms check box in Figure 6 and select the Time spent in % check box to make sure that the response time at every point cut is displayed as a percentage of total transaction response time. The percentage will enable you to better judge where the transaction spent maximum time.
You can also choose the Component type or Component name options in Figure 6 to have the component type only or the component name only (as the case may be) displayed for each of the nodes in the cross-application transaction flow. By default, both component type and name will be displayed for each node.
Let us now explore the Summary section of the call drill down. For that, click the Summary option in the left panel of Figure 4. Figure 7 will appear.
![]()
Figure 7 : A summary of the performance of the JVM node, Address-Validation-Service1:7878
The Summary section provides a quick summary of the performance of the monitored transaction, LanguageService.jsp, on the JVM node that executed the slow database query – i.e., the Oracle WebLogic server, Address-Validation-Service1:7001. .
From the Summary, you can infer that the LanguageService transaction was processed for a total of 19814 milliseconds on Address-Validation-Service1:7001. If you take a look at the transaction topology now (see Figure 8), you will be able to understand that this processing time is the sum of the following:
- The time for which the transaction was processed internally by the Address-Validation-Service1:7001 server – 151 ms
- The time taken by Address-Validation-Service1:7001 to execute a database query for the transaction and retrieve results – 19339 ms
- The time taken by Address-Validation-Service1:7001 to make a JMS call to a messaging server and pull data from the message queue OrderQueue – 319 ms
-
The time taken by Address-Validation-Service1:7001 to make a SAP JCO call to a SAP server – 5 ms
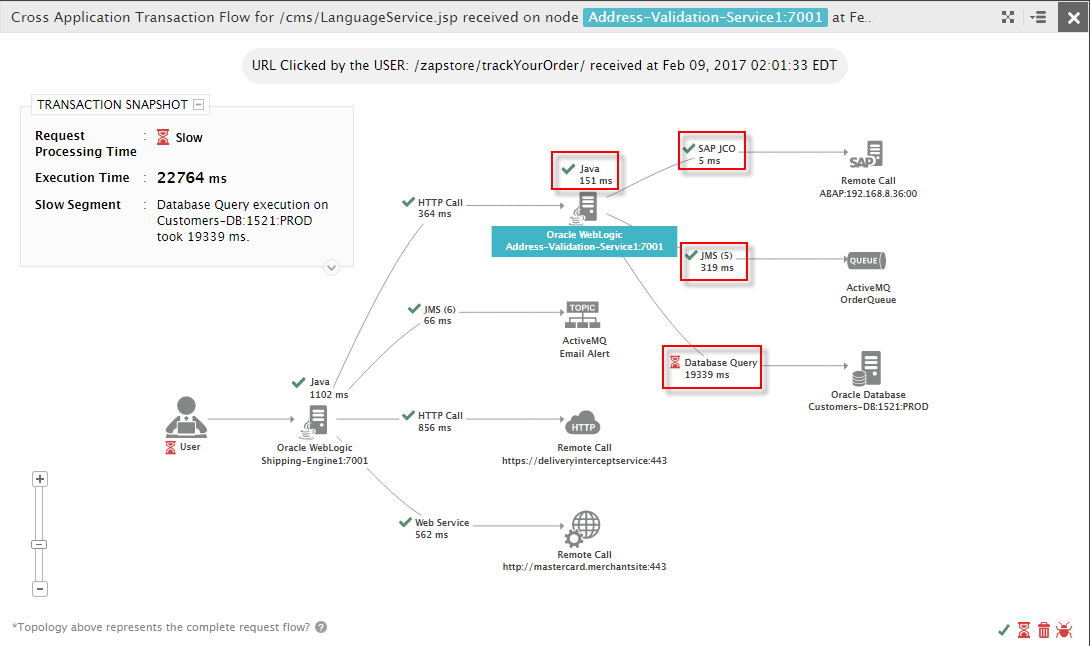
Figure 8 : How the total processing time of the transaction on Address-Validation-Service1:7001 is computed
The Breakup of Processing Time section in Figure 7 clearly indicates how the Total Processing time is computed. From this section, you can also glean where the slowdown originated – within the JVM node? Or when making external calls from the JVM node? In the case of our example, the problem is with the remote calls.
Next, take a look at the url displayed in the Summary section. As you can see, the URL is that of the Business Transaction that was zoomed into - i.e., LanguageService.jsp. However, sometimes, while the Business Transaction may continue to be LanguageService.jsp, the url could be different. This is because, the URL refers to the URL that was hit when an HTTP call is made by one JVM node to another. This means that when accessing the LanguageService.jsp web page on Address-Validation-Service1:7001, if that web page had hit another URL, then that URL will be displayed against URL.
Additionally, the Summary section also reports the Query String of the URL, the Session ID of the session in which the transaction is processed on the Address-Validation-Service1:7878 server, and Thread Name of the thread that processed the transaction.
The Summary section also differentiates between the overall User Experience of a transaction and the Java Processing Status of that transaction on a particular JVM node. In the case of our example, the Summary section clearly reveals that the User Experience of the transaction is Slow. At the same time, eG has also detected that the slowness did not occur because of a processing bottleneck on the Address-Validation-Service1:7001 server. This is why, eG maintains that the Java Processing Status of the Address-Validation-Service1:7001 server is Healthy.