Detailed Diagnostics Revealing the Root-cause of an Error Transaction
The detailed diagnosis of the Error transactions measure reveals the complete URLs of the error transactions of a particular business transaction pattern. The total response time of each error transaction and the time at wihich every such transaction was requested can be ascertained from the detailed diagnosis. To zoom into the nature of the error and where it occurred, click on the ‘magnifying glass’ icon against the corresponding ‘Error’ icon in the transaction user experience column of Figure 1.

Figure 1 : The detailed diagnosis of the Error transactions measure
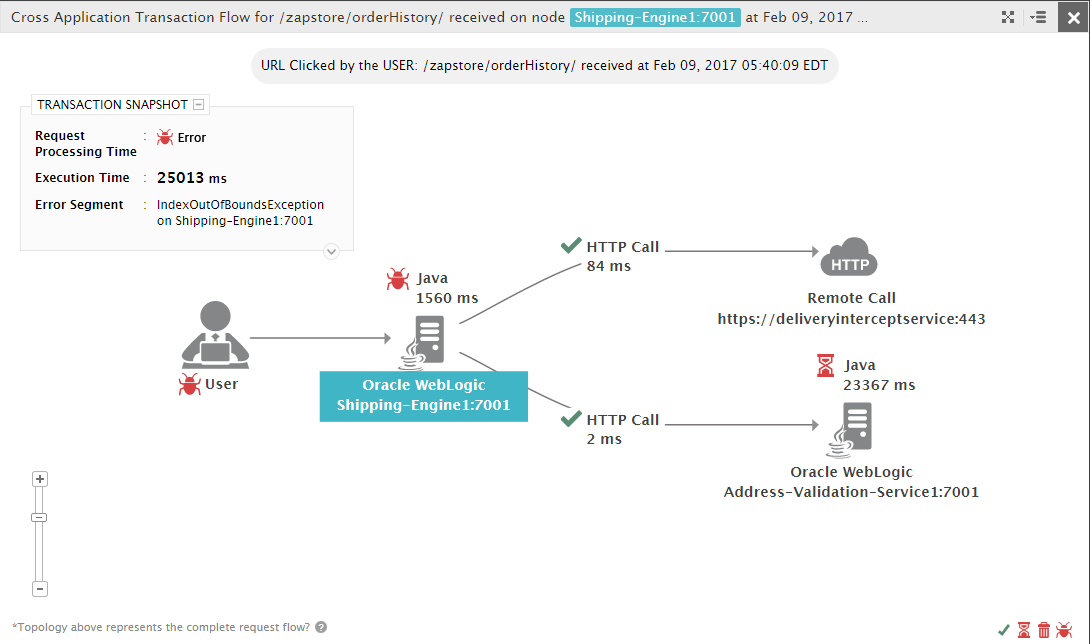
Figure 2 will then appear, which will chart the entire path of the error transaction end-to-end. Using conventional color-codes, this visual representation will accurately pinpoint where the error has occurred.

Figure 2 : The error transaction path revealing where the error has occurred
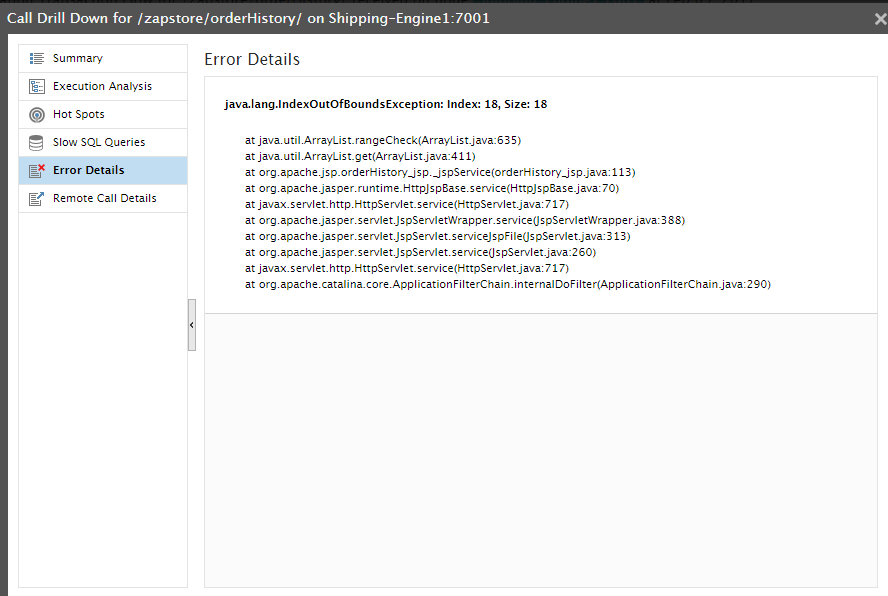
In the example of above, the error seems to have occurred on the Shipping-Engine1:7001 (Oracle WebLogic) server being monitored. To know what the error is, click on the Shipping-Engine1:7001 server in .
Figure 3 that appears next opens an Error Details section, which displays the complete details of the error.
