How does the eG Java BTM Work?
To be able to track the live transactions to a web application, eG Enterprise requires that a special eG Java Transaction Profiler be deployed on every JVM node (i.e., web ccserver instance) through which the transaction travels. The steps for deployment are discussed in Installing and Configuring eG Java BTM section.
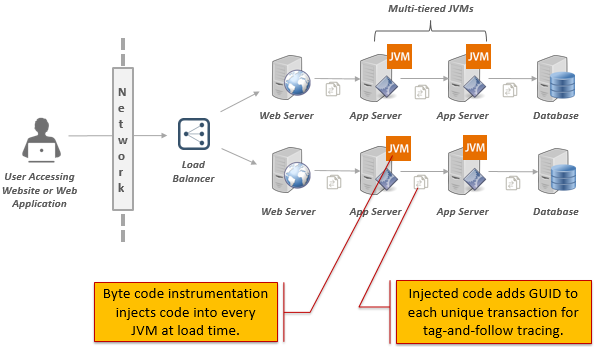
Figure 1 : How eG BTM Works?
The eG Java Transaction Profiler uses byte-code instrumentation to trace transaction path and measure responsiveness. Using this instrumentation mechanism, the profiler injects Java code into the JVM on which it is deployed, at load time. The injected code adds a GUID to each unique transaction on a JVM, so that its path can be accurately traced . In addition, the profiler performs the following tasks for every unique transaction on a JVM:
- Tracks requests to that transaction;
- Measures the average responsiveness of that transaction to the requests;
- Identifies the slow, stalled, and error transactions, and computes the count of such transactions;
- Ascertains the exit calls made by the transaction, the destination of the calls, and measures the time taken by each call;
- Stores all the aforesaid statistics in memory
The profiler then sends all these statistics to the eG agent. To know how and when the profiler transmits metrics to the eG agent, refer to How does the eG Java BTM Communicate with the eG Agent?
The eG agent deployed on a remote host or on the BTM-enabled JVM periodically runs a Java Business Transactions test. This test communicates with the profiler via a configured BTM port, pulls the metrics stored in memory, and reports them to the eG manager for display in the eG monitoring console.