Jenkins Nodes Test
Jenkins uses a Master-Slave architecture to manage distributed builds. In this architecture, Master and Slave nodes communicate through TCP/IP protocol. The main Jenkins server acts as the Master node that manages slaves. A slave is a Java executable that runs on a remote machine. The diagram shows a Jenkins Master-Slave architecture.
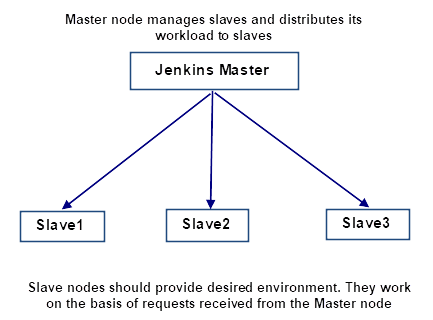
Figure 1 : Jenkins Master-Slave architecture
Following are the jobs handled by the Jenkins Master’s:
-
Scheduling build jobs.
-
Dispatching builds to the slaves for the actual execution.
-
Monitor the slaves (possibly taking them online and offline as required).
-
Recording and presenting the build results.
-
A Master node can also execute build jobs directly.
Following are the characteristics of Jenkins Slaves:
-
Slaves receive requests from the Jenkins Master node.
-
Slaves can run on a variety of operating systems.
-
The job of a Slave is to do tasks as per the requests passed from the Master node, which involves executing build jobs dispatched by the Master.
With Master-Slave architecture, Jenkins enables administrators to distribute load across the Slave nodes through the Master node based on the resources needed for running the jobs. If the Master node goes offline due to any abnormality, the workload will not be distributed to the Slave nodes, and executors will not be assigned to run jobs on the Slave nodes. Besides, the Slave nodes will not be able to execute the jobs without executors and resources. This will adversely impact the development cycle, reduce productivity and degrade the integrity of Jenkins and user experience . To avoid such inconveniences, administrators should continuously track the availability and resource utilization of nodes. This can be easily achieved using the Jenkins Nodes test.
This test auto-discovers the nodes in the target Jenkins server, and reports the status of each node. This test also reveals the disk space and memory utilization of each node, the count of executors that are running jobs on each node, etc.
Target of the test : A Jenkins server
Agent deploying the test : An internal agent
Outputs of the test : One set of results for each node on the target Jenkins server.
| Parameter | Description |
|
Test period |
How often should the test be executed |
|
Host |
The host for which the test is to be configured. |
|
Port |
The port at which the specified host listens. |
|
Username and Password |
Specify the valid credentials of a user who has Read-only access to the Jenkins REST API to gather performance metrics from the target Jenkins server against the Username and Password parameters. |
|
Confirm Password |
Confirm the Password by retyping it here. |
|
SSL |
By default, the SSL flag is set to No, indicating that the target Microsoft SQL server is not SSL-enabled by default. To enable the test to connect to an SSL-enabled Microsoft SQL server, set the SSL flag to Yes. |
|
DD Frequency |
Refers to the frequency with which detailed diagnosis measures are to be generated for this test. The default is 1:1. This indicates that, by default, detailed measures will be generated every time this test runs, and also every time the test detects a problem. You can modify this frequency, if you so desire. Also, if you intend to disable the detailed diagnosis capability for this test, you can do so by specifying none against DD frequency. |
|
Detailed Diagnosis |
To make diagnosis more efficient and accurate, the eG Enterprise suite embeds an optional detailed diagnostic capability. With this capability, the eG agents can be configured to run detailed, more elaborate tests as and when specific problems are detected. To enable the detailed diagnosis capability of this test for a particular server, choose the On option. To disable the capability, click on the Off option. The option to selectively enable/disable the detailed diagnosis capability will be available only if the following conditions are fulfilled:
|
| Measurement | Description | Measurement Unit | Interpretation | ||||||||
|---|---|---|---|---|---|---|---|---|---|---|---|
|
Node status |
Indicates the current status of this node. |
|
The values reported by this measure and its numeric equivalents are mentioned in the table below:
Note: By default, this measure reports the current status of each application. The graph of this measure however, is represented using the numeric equivalents only. |
||||||||
|
Total executors |
Indicates the total number of executors running on this node. |
Number |
A Jenkins executor is one of the basic building blocks which allow a build to run on a node/agent (e.g. build server). |
||||||||
|
Free disk space |
Indicates the amount of space available for use on this node. |
GB |
Ideally, the value of this measure should be high. |
||||||||
|
Free swap space |
Indicates the amount of swap space available for use on this node. |
GB |
|
||||||||
|
Free temp space |
Indicates the amount of temporary space available for use on this node. |
GB |
|
||||||||
|
Response time |
Indicates how quickly this node responds to the requests. |
Milliseconds |
Ideally, a low value is desired for this measure. Compare the value of this measure across the nodes to identify which node is slow in responding to the requests. |
||||||||
|
Total memory |
Indicates the total memory on this node. |
GB |
|
||||||||
|
Used memory |
Indicates the amount of memory utilized on this node. |
GB |
If the value of this measure is equal/close to the value of Total memory measure, it indicates that the node is running out of memory, which requires immediate attention of administrators. |
||||||||
|
Free memory |
Indicates the amount of memory available for use on this node. |
GB |
Ideally, a high value is desired for this measure. |
||||||||
|
Memory utilization |
Indicates the percentage of memory utilized on this node. |
Percent |
|
||||||||
|
System load average |
Indicates the average CPU load on this node. |
Percent |
|
||||||||
|
Clock difference |
Indicates the clock difference between the slave node and the master node. |
|
The values reported by this measure and its numeric equivalents are mentioned in the table below:
Note: By default, this measure reports the Measure Values listed in the table above to clock difference on each node. The graph of this measure however, represents the measure values using the numeric equivalents only. |
||||||||
|
Busy executors |
Indicates the number of executors that are currently executing jobs on this node. |
Number |
A high value represents that more number of jobs are being executed on this node. |
||||||||
|
Idle executors |
Indicates the number of executors that are currently in the idle state on this node. |
Number |
|
||||||||
|
Tied jobs |
Indicates the number of jobs tied or assigned to this node |
Number |
|