Monitoring the Jenkins Server
eG Enterprise offers a specialized Jenkins monitoring model (see Figure 1) periodically monitors the target Jenkins server and reports wealth of information related to performance of Jenkins nodes, jobs executing on the Jenkins nodes and the queues. Using this information, administrators can instantly identify the bottlenecks (if any) and initiate remedial actions before they impact overall performance of the Jenkins server.
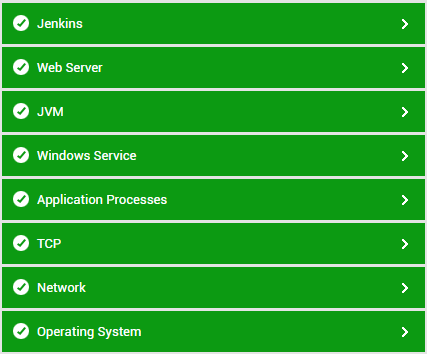
Figure 1 : Layer model of the Jenkins server
Each layer of Figure 1 is mapped to tests that reveal the status of Jenkins nodes, job health, etc. Using the metrics reported by these tests, administrators can find quick and accurate answers to certain persistent performance queries, such as the following:
- What is the current status of each node on the Jenkins server?
- How well the disk space on each node is utilized?
- How long each node is taking to respond to the requests?
- How well the memory allocated to each node is utilized?
- What is the average CPU load of each node?
- How many executors are idle on each node?
- How many jobs are tied to each node?
- What is the current status of each job executing on the Jenkins node?
- How many times each job is executed on the Jenkins node?
- How many times each job failed or aborted?
- What is the current health of each job?
- How long it takes to execute each job?
- Is any job in the queue stuck/blocked?
- Is any job waiting in the queue for a prolonged period?
The five layers at the bottom of Figure 1 have been dealt with extensively in the Monitoring Unix and Windows Servers document. For the details on the Web Server layer, refer to the Monitoring Microsoft IIS Web Server document. To know how to configure the tests mapped to the JVM layer, refer to the Monitoring Java Application document. The section that follows will discuss the Jenkins layer alone.