Kubelet Go Engine Test
The Go engine allows the Kubelet to handle tasks like monitoring container health, managing resource allocation, and interacting with container run times. Its design leverages Go's concurrency features to efficiently handle multiple tasks, ensuring robust and responsive container management across the cluster. Given the key role that Kubelet plays in container management and it being powered by Go Engine, it is imperative that Go Engine is monitored.
This test monitors the Kubelet Go Engine and and reveal the key metrics like number of threads created, currently existing go routines, etc. These metrics are very useful is analyzing the performance of the Kubelet at any given time.
Target of the test : A Kubernetes Worker Node
Agent deploying the test : An internal agent
Outputs of the test : One set of results for target Kubernetes Worker node being monitored.
|
Parameter |
Description |
|---|---|
|
Test Period |
How often should the test be executed. |
|
Host |
The IP address of the host for which this test is to be configured. |
|
Port |
Specify the port at which the specified Host listens. By default, this is 6443. |
|
Timeout |
Specify the duration (in seconds) beyond which the test will timeout in the Timeout text box. The default value is 10 seconds. |
|
Metric URL |
Each of the Kubernetes system components expose monitoring metrics through /metrics endpoint of the HTTP server. Specify the metric endpoint URL in the Metric URL textbox. |
|
DD Frequency |
Refers to the frequency with which detailed diagnosis measures are to be generated for this test. The default is 3:1. This indicates that, by default, detailed measures will be generated every third time this test runs, and also every time the test detects a problem. You can modify this frequency, if you so desire. Also, if you intend to disable the detailed diagnosis capability for this test, you can do so by specifying none against DD frequency. |
|
Detailed Diagnosis |
To make diagnosis more efficient and accurate, the eG Enterprise embeds an optional detailed diagnostic capability. With this capability, the eG agents can be configured to run detailed, more elaborate tests as and when specific problems are detected. To enable the detailed diagnosis capability of this test for a particular server, choose the On option. To disable the capability, click on the Off option. The option to selectively enable/disable the detailed diagnosis capability will be available only if the following conditions are fulfilled:
|
|
Measurement |
Description |
Measurement Unit |
Interpretation |
||||||
|---|---|---|---|---|---|---|---|---|---|
|
OS threads created |
Indicates the number of OS threads created by Kubelet Go engine. |
Number |
The number of threads can enhance the performance by providing more concurrency but can also affect the performance adversely if the threads are laying idle. |
||||||
|
Goroutines that currently exist |
Indicates the current number of Goroutines that are existing and executing. |
Number |
A high number of goroutines may indicate the code is not managed well and can lead to low maintainability. |
||||||
|
Go environment details available |
Indicates if the current environment details are available for Go engine. |
|
The values that this measure reports and their corresponding numeric values are detailed in the table below:
Note: By default, this test reports the Measure Values listed in the table above to indicate if Go environment details are available. In the graph of this measure however, the state is indicated using the numeric equivalents only. The detailed diagnosis of the Go environment details available measure reveals the Go Environment version information. |
||||||
|
Kubernetes build information available |
Indicates if the build information is available for Kubernetes. |
|
The values that this measure reports and their corresponding numeric values are detailed in the table below:
Note: By default, this test reports the Measure Values listed in the table above to indicates if Kubernetes build information is available. In the graph of this measure however, the state is indicated using the numeric equivalents only. The detailed diagnosis of the Kubernetes build ino available available measure reveals Build date, Compiler, Git commit id, Git tree state, Go version, Major, Minor, Platform. |
The detailed diagnosis of the Go environment details available measure reveals the Go Environment version information.
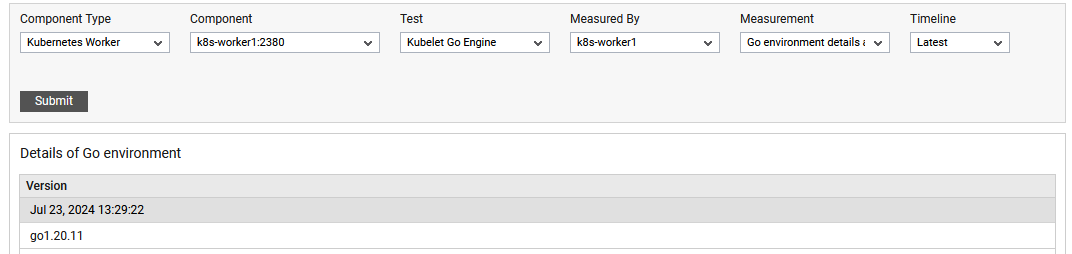
Figure 1 : The detailed diagnosis of Go environment details available measure
The detailed diagnosis of the Kubernetes build ino available available measure reveals Build date, Compiler, Git commit id, Git tree state, Go version, Major, Minor, Platform.
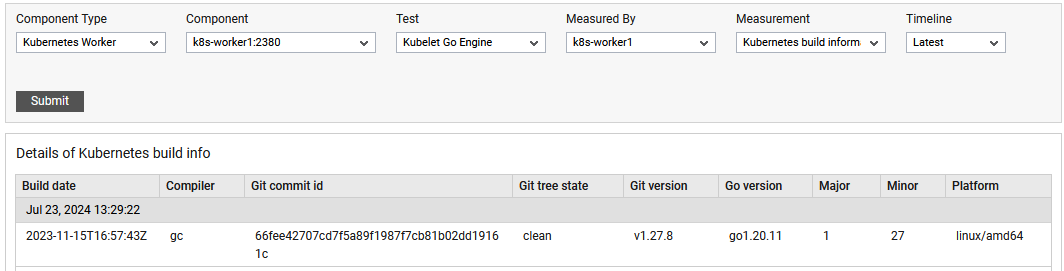
Figure 2 : The detailed diagnosis of Kubernetes build information available measure