Pods Status Test
Kubernetes pod statuses help track the state of pods within a cluster. Monitoring pod status in Kubernetes is essential for ensuring application health and performance. It helps detect issues early, such as resource shortages or container failures, enabling timely interventions. Understanding pod status aids in scaling decisions, troubleshooting, and maintaining service reliability. By monitoring, teams can ensure optimal resource utilization and enhance the overall stability of their applications.
The Pods Status Test continuously monitors the Pods and reports key performance metrics like number of running pods, total pods, stopped pods etc.. Analysis of these numbers over a series of measurement give administrators vital information about the current performance of Pod and can easily notice any dips in performance.
Target of the test : A Kubernetes Worker Node
Agent deploying the test : An internal agent
Outputs of the test : One set of results for each pod in the target Kubernetes Worker node being monitored
|
Parameter |
Description |
|---|---|
|
Test Period |
How often should the test be executed. |
|
Host |
The IP address of the host for which this test is to be configured. |
|
Port |
Specify the port at which the specified Host listens. By default, this is 6443. |
|
Use Sudo |
By default, the eG agent does not require any special permissions to parse and read messages from the log file to be monitored. This is why, the Use Sudo parameter is set to No by default. In some highly-secure Unix environments however, the eG agentinstall user may not have the permission to read the log file to be monitored. In such environments, you will have to follow the steps below to ensure that the test is able to read the log file and report metrics: Edit the SUDOERS file on the target host and append an entry of the following format to it: <eG_agent_install_user> ALL=(ALL) NOPASSWD: <Log_file_with_path> For instance, if the eG agent install user is eguser, and the log file to be monitored is /usr/bin/logs/procs.log, then the entry in the SUDOERS file should be: eguser ALL=(ALL) NOPASSWD: /usr/bin/logs/procs.log Finally, save the file. Then, when configuring this test using the eG admin interface, set the Use Sudo parameter to Yes. Once this is done, then every time the test runs, it will check whether the eG agent install user has the necessary permissions to read the log file. If the user does not have the permissions, then the test runs the sudo command to change the permissions of the user, so that the eG agent is able to read from the log file. |
|
Show total pod in DD |
By default, Show total pod in DD flag is set to No, indicating that this test will not report detailed diagnostics for the total pods. You can enable the detailed diagnosis capability of the total pods measure by setting this flag to Yes. |
|
DD Frequency |
Refers to the frequency with which detailed diagnosis measures are to be generated for this test. The default is 3:1. This indicates that, by default, detailed measures will be generated every third time this test runs, and also every time the test detects a problem. You can modify this frequency, if you so desire. Also, if you intend to disable the detailed diagnosis capability for this test, you can do so by specifying none against DD frequency. |
|
Detailed Diagnosis |
To make diagnosis more efficient and accurate, the eG Enterprise embeds an optional detailed diagnostic capability. With this capability, the eG agents can be configured to run detailed, more elaborate tests as and when specific problems are detected. To enable the detailed diagnosis capability of this test for a particular server, choose the On option. To disable the capability, click on the Off option. The option to selectively enable/disable the detailed diagnosis capability will be available only if the following conditions are fulfilled:
|
|
Measurement |
Description |
Measurement Unit |
Interpretation |
|---|---|---|---|
|
Total pods |
Indicates the total number of pods existing on the node. |
Number |
|
|
Running pods |
Indicates the number of running pods on the cluster. |
Number |
For optimal performance the number of running pods should be higher as a percentage of total number of pods. |
|
Stopped pods |
Indicates the number of stopped pods on the cluster. |
Number |
|
The detailed diagnosis of the Running pods measure reveals the Pod Name, Namespace Pod Ip adress and Created Time.
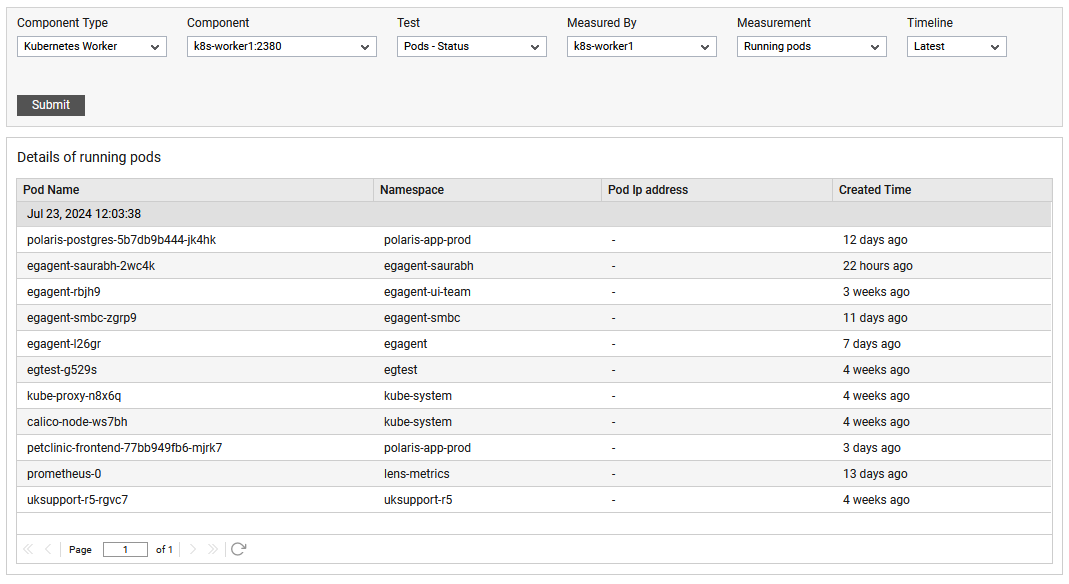
Figure 1 : The detailed diagnosis of running pods
The detailed diagnosis of the Stopped pods measure reveals the Pod Name, Namespace Pod Ip adress and Created Time.
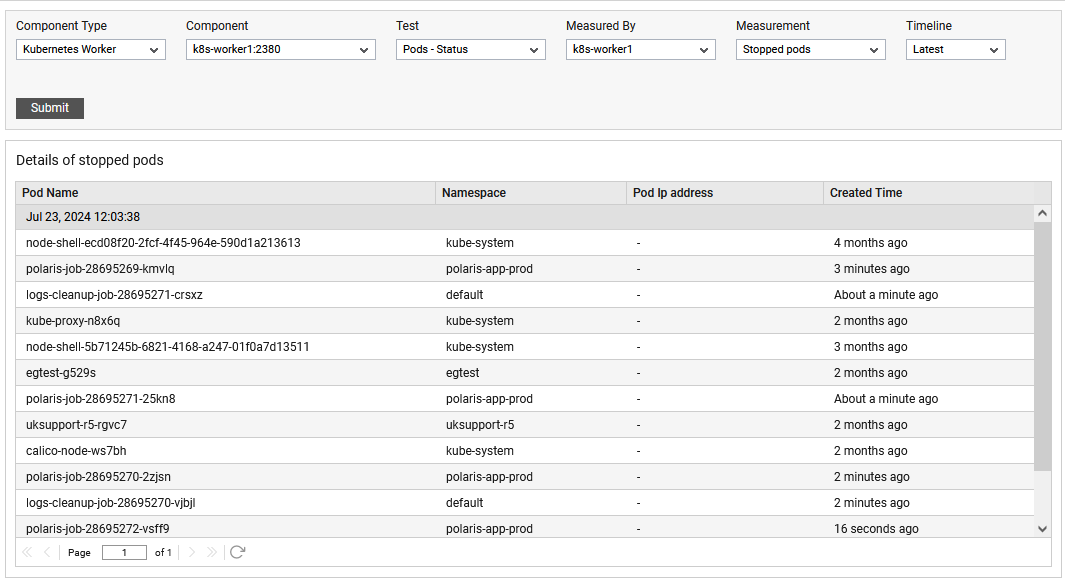
Figure 2 : The detailed diagnosis of stopped pods