K8s DaemonSets By Namespace Test
A DaemonSet ensures that all (or some) Nodes run a copy of a Pod. As nodes are added to the cluster, Pods are added to them. As nodes are removed from the cluster, those Pods are garbage collected. Deleting a DaemonSet will clean up the Pods it created.
Some typical uses of a DaemonSet are:
- running a cluster storage daemon, such as glusterd, ceph, on each node.
- running a logs collection daemon on every node, such as fluentd or logstash.
- running a node monitoring daemon on every node
Daemon pods are typically scheduled using one of the following:
- Daemonset Controller: Normally, the machine that a Pod runs on is selected by the Kubernetes scheduler. However, Pods created by the DaemonSet controller have the machine already selected .
- Default scheduler: You can also schedule DaemonSets using the default scheduler instead of the DaemonSet controller, by adding the NodeAffinity term to the DaemonSet pods, instead of the .spec.nodeName term. The default scheduler is then used to bind the pod to the target host.
Regardless of which scheduler (Daemonset Controller or default scheduler) schedules Daemon Pods, taints and tolerations are used to ensure that Daemon pods are not scheduled onto inappropriate nodes. One or more taints are applied to a node; this marks that the node should not accept any pods that do not tolerate the taints. Tolerations are applied to pods, and allow (but do not require) the pods to schedule onto nodes with matching taints.
Sometimes, a Daemon Pod may be 'misscheduled' on to a node where it does not belong. In other words, a Daemon Pod could be scheduled on to a node without 'matching taints'. This can cause certain cluster operations to run on nodes they should not run on, hampering cluster performance in the process. At some other times, a Daemon Pod may not run on the desired set of nodes. For instance, an anti-virus daemon, which should typically run on all nodes in a cluster/namespace, may run only on a few nodes. This is also detrimental to cluster performance. To ensure peak cluster performance, administrators should rapidly identify misscheduled DaemonSets and those that are not running on the desired nodes, and figure out what could have triggerred these anomalies. This is where the DaemonSet by Namespace test helps!
This test auto-discovers the DaemonSets in each namespace, and for each DaemonSet, reports the count of nodes scheduled to run that DaemonSet, the count of nodes on which it should run, and the count of nodes on which it should not. This way, the test promptly alerts administrators to incorrect scheduling of DaemonSets. Detailed diagnostics reveal which Daemon Pods are running on which node, thereby enabling administrators to quickly identify those nodes running Daemon Pods they should not be running. Additionally, the test also alerts administrators if a DaemonSet is updated.
Target of the test : A Kubernetes/OpenShift Cluster
Agent deploying the test : A remote agent
Outputs of the test : One set of results for each DaemonSet in every namespace configured in the Kubernetes/OpenShift cluster being monitored
First-level Descriptor: Namespace
Second-level Descriptor: DaemonSet
| Parameter | Description |
|---|---|
|
Test Period |
How often should the test be executed. |
|
Host |
The IP address of the host for which this test is to be configured. |
|
Port |
Specify the port at which the specified Host listens. By default, this is 6443. |
|
Load Balancer / Master Node IP |
To run this test and report metrics, the eG agent needs to connect to the Kubernetes API on the master node and run API commands. To enable this connection, the eG agent has to be configured with either of the following:
By default, this parameter will display the Load Balancer / Master Node IP that you configured when manually adding the Kubernetes/OpenShift cluster for monitoring, using the Kubernetes Cluster Preferences page in the eG admin interface (see Figure 3). The steps for managing the cluster using the eG admin interface are discussed elaborately in How to Monitor the Kubernetes/OpenShift Cluster Using eG Enterprise? Whenever the eG agent runs this test, it uses the IP address that is displayed (by default) against this parameter to connect to the Kubernetes API. If there is any change in this IP address at a later point in time, then make sure that you update this parameter with it, by overriding its default setting. |
|
K8s Cluster API Prefix |
By default, this parameter is set to none. Do not disturb this setting if you are monitoring a Kubernetes/OpenShift Cluster. To run this test and report metrics for Rancher clusters, the eG agent needs to connect to the Kubernetes API on the master node of the Rancher cluster and run API commands. The Kubernetes API of Rancher clusters is of the default format: http(s)://{IP Address of kubernetes}/{api endpoints}. The Server section of the kubeconfig.yaml file downloaded from the Rancher console helps in identifying the Kubernetes API of the cluster. For e.g., https://{IP address of Kubernetes}/k8s/clusters/c-m-bznxvg4w/ is usually the URL of the Kubernetes API of a Rancher cluster. For the eG agent to connect to the master node of a Rancher cluster and pull out metrics, the eG agent should be made aware of the API endpoints in the Kubernetes API of the Rancher cluster. To aid this, you can specify the API endpoints available in the Kubernetes API of the Rancher cluster against this parameter. In our example, this parameter can be specified as: /k8s/clusters/c-m-bznxvg4w/. |
|
SSL |
By default, the Kubernetes/OpenShift cluster is SSL-enabled. This is why, the eG agent, by default, connects to the Kubernetes API via an HTTPS connection. Accordingly, this flag is set to Yes by default. If the cluster is not SSL-enabled in your environment, then set this flag to No. |
|
Authentication Token |
The eG agent requires an authentication bearer token to access the Kubernetes API, run API commands on the cluster, and pull metrics of interest. The steps for generating this token have been detailed in How Does eG Enterprise Monitor a Kubernetes/OpenShift Cluster?
Typically, once you generate the token, you can associate that token with the target Kubernetes/OpenShift cluster, when manually adding that cluster for monitoring using the eG admin interface. The steps for managing the cluster using the eG admin interface are discussed elaborately in How to Monitor the Kubernetes/OpenShift Cluster Using eG Enterprise? By default, this parameter will display the Authentication Token that you provided in the Kubernetes Cluster Preferences page of the eG admin interface, when manually adding the cluster for monitoring (see Figure 3). Whenever the eG agent runs this test, it uses the token that is displayed (by default) against this parameter for accessing the API and pulling metrics. If for any reason, you generate a new authentication token for the target cluster at a later point in time, then make sure you update this parameter with the change. For that, copy the new token and paste it against this parameter. |
|
Proxy Host |
If the eG agent connects to the Kubernetes API on the master node via a proxy server, then provide the IP address of the proxy server here. If no proxy is used, then the default setting -none - of this parameter, need not be changed, |
|
Proxy Port |
If the eG agent connects to the Kubernetes API on the master node via a proxy server, then provide the port number at which that proxy server listens here. If no proxy is used, then the default setting -none - of this parameter, need not be changed, |
|
Proxy Username, Proxy Password, Confirm Password |
These parameters are applicable only if the eG agent uses a proxy server to connect to the Kubernetes/OpenShift cluster, and that proxy server requires authentication. In this case, provide a valid user name and password against the Proxy Username and Proxy Password parameters, respectively. Then, confirm the password by retyping it in the Confirm Password text box. If no proxy server is used, or if the proxy server used does not require authentication, then the default setting - none - of these parameters, need not be changed. |
|
DD Frequency |
Refers to the frequency with which detailed diagnosis measures are to be generated for this test. The default is 3:1. This indicates that, by default, detailed measures will be generated every third time this test runs, and also every time the test detects a problem. You can modify this frequency, if you so desire. Also, if you intend to disable the detailed diagnosis capability for this test, you can do so by specifying none against DD frequency. |
|
Detailed Diagnosis |
To make diagnosis more efficient and accurate, the eG Enterprise embeds an optional detailed diagnostic capability. With this capability, the eG agents can be configured to run detailed, more elaborate tests as and when specific problems are detected. To enable the detailed diagnosis capability of this test for a particular server, choose the On option. To disable the capability, click on the Off option. The option to selectively enable/disable the detailed diagnosis capability will be available only if the following conditions are fulfilled:
|
| Measurement | Description | Measurement Unit | Interpretation |
|---|---|---|---|
|
Time since DaemonSet creation |
Indicates how old this DaemonSet is. |
|
The value of this measure is expressed in number of days, hours, and minutes. You can use the detailed diagnosis of this measure to know the labels and images used by the daemons run by the DaemonSet. |
|
Current nodes for DaemonSet |
Indicates the number of nodes (in this namespace) that are currently running this DaemonSet and are supposed to run this DaemonSet. |
Number |
Use the detailed diagnosis of this measure to know which Daemon Pods are running on which nodes in the namespace. |
|
Mis-scheduled nodes for DaemonSet |
Indicates the number of nodes in this namespace, that are running this DaemonSet, but are not supposed to run this DaemonSet. |
Number |
Ideally, the value of this measure should be 0. |
|
Desired nodes for DaemonSet |
Indicates the number of nodes (in this namespace) that should be running this DaemonSet. |
Number |
The value of this measure also includes the count of nodes that are already running the DaemonSet. Ideally therefore, this value of this measure should be the same as the value of the DaemonSet currently scheduled on nodes measure. Any mismatch implies issues in scheduling, which in turn may impact cluster performance. |
|
Ready nodes for DaemonSet |
Indicates the number of nodes (in this namespace) that should be running this DaemonSet and have one or more of the Daemon Pods already running and ready. |
Number |
|
|
Updated nodes for DaemonSet |
Indicates the number of nodes (in this namespace) that run the updated daemon pod spec. |
Number |
Updating a DaemonSet may involve:
|
|
Available nodes for DaemonSet |
Indicates the number of nodes (in this namespace) that should be running this DaemonSet and have one or more of the Daemon Pods running and available. |
Number |
A Daemon Pod is considered to be 'available' if it is ready without any of its containers crashing for at least the duration specified against spec.minReadySeconds in the DaemonSet configuration (YAML) file. |
|
Nodes on which DaemonSet is unavailable |
Indicates the number of nodes (in this namespace) that should be running this DaemonSet, but does not have it running and available. |
Number |
A Daemon Pod is considered to be 'unavailable' if it is not ready without any of its containers crashing for even the minimum duration specified against spec.minReadySeconds in the DaemonSet configuration (YAML) file. Ideally, the value of this measure should be 0. |
|
CPU usage |
Indicates the total amount of CPU resources consumed by all the pods that belong to this DaemonSet. |
Millicpu |
A high value indicates that the DaemonSet is consuming more CPU than expected. |
|
CPU limits |
Indicates that maximum amount of CPU resources that the pods in this DaemonSet can use. |
Millicpu |
|
|
CPU requests |
Indicates the minimum CPU resources guaranteed to the pods in this DaemonSet. |
Millicpu |
|
|
CPU throttled as percent of Node CPU configured |
Indicates the percentage of the node's total CPU capacity that has been throttled due to CPU limits set on the containers within this DaemonSet in this namespace. |
Percent |
|
|
CPU slack |
Indicates the total amount of CPU resources that are available but not currently requested or used any pods in this DaemonSet. |
Millicpu |
A low value for this measure indicates resource contention. |
|
Memory usage |
Indicates the total memory consumed by all the pods managed by this DaemonSet. |
GB |
This measure tracks the actual memory usage of the containers running in the pods managed by the DaemonSet. |
|
Memory limits |
Indicates the maximum amount of memory resources that the pods in this DaemonSet can use. |
GB |
The memory limit for pods in a DaemonSet specifies the maximum amount of memory that each pod in the DaemonSet can use. If any pod exceeds this limit, it will be terminated and possibly restarted, depending on the pod's restart policy. |
|
Memory requests |
Indicates the minimum memory resources guaranteed to the pods in this DaemonSet. |
GB |
If a pod's memory usage is within its memory request, it is less likely to be evicted due to memory pressure. |
|
Memory slack |
Indicates the amount of memory available but not yet requested by any pods in this DaemonSet. |
GB |
If the available memory is low and the slack is minimal, it may indicate that DaemonSet pods are consuming most of the node's memory, which can lead to resource contention with other workloads on the node. |
|
CPU throttled |
Indicates the amount of CPU time that was throttled due to containers exceeding their configured CPU limits within this DaemonSet in this namespace. |
Millicpu |
|
Using the detailed diagnosis of the Age measure you can determine the label that has been assigned to a particular DaemonSet, and the images that the containers on the Daemon Pods are pulling from the Container Registry.
.png)
Figure 1 : The detailed diagnosis of the Age measure of the DaemonSet by Namespace test
To know the Daemon Pods running a DaemonSet and the nodes on which these Pods are running, use the detailed diagnosis of the DaemonSet currently scheduled on nodes measure. Using this information, you can figure out if the DaemonSet is running on a node it is not supposed to run on and if it is not running on any node it should actually run on.
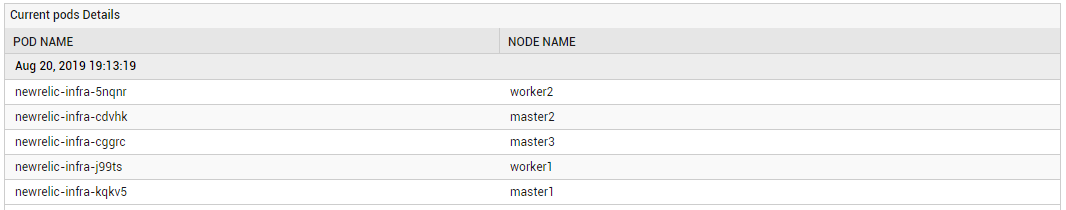
Figure 2 : The detailed diagnosis of the DaemonSet currently scheduled on nodes measure