K8s Deployments By Namespace Test
A Deployment provides declarative updates for Pods and ReplicaSets. While a Pod encapsulates an application’s container (or, in some cases, multiple containers), storage resources, a unique network IP, and options that govern how the container(s) should run, a ReplicaSet is used to maintain a stable set of replica (identical) Pods running at any given time.
Using a Deployment, you can easily:
- Deploy a ReplicaSet
- Update Pods (PodTemplateSpec)
- Rollback to older Deployment versions
- Scale Deployment up or down
- Pause and resume the Deployment
- Determine state of replicas
- Clean up older ReplicaSets
- Canary Deployment
Whenever a Deployment is used to perform such operations, it is only natural that administrators want to know the status of the deployment - whether it is paused or progressing. Most importantly, administrators will want to be alerted if the Deployment was unable to deliver the intended/desired result of the operation. For instance, an administrator would want to be alerted if any deployment fails to create the desired number of available replicas in a ReplicaSet, fails to update one/more replicas with changes to a Pod template, or does not have the adequate number of Pods to reach full capacity. This is because, such failures may result in a mismatch between the cluster's desired state and its actual state, which in turn may affect the availability and performance of the containerized applications that overlay the cluster. This is where the Deployments by Namespace test helps!
This test auto-discovers Deployments in a Namespace, and for each Deployment, reports the overall status of the deployment - i.e., whether the desired state of the Deployment is the same as its actual state. If the state of the Deployment is Unhealthy, then you can use this test to figure out what could have caused the anomaly - is it because of a replica failure? is it because of unavailable Pods? or is it because of the Pods that are not yet up-to-date with changes made to the Pod template?
Target of the test : A Kubernetes/OpenShift Cluster
Agent deploying the test : A remote agent
Outputs of the test : One set of results for each Deployment in every namespace configured in the Kubernetes/OpenShift cluster being monitored
First-level Descriptor: Namespace
Second-level Descriptor: Deployment
| Parameter | Description |
|---|---|
|
Test Period |
How often should the test be executed. |
|
Host |
The IP address of the host for which this test is to be configured. |
|
Port |
Specify the port at which the specified Host listens. By default, this is 6443. |
|
Load Balancer / Master Node IP |
To run this test and report metrics, the eG agent needs to connect to the Kubernetes API on the master node and run API commands. To enable this connection, the eG agent has to be configured with either of the following:
By default, this parameter will display the Load Balancer / Master Node IP that you configured when manually adding the Kubernetes/OpenShift cluster for monitoring, using the Kubernetes Cluster Preferences page in the eG admin interface (see Figure 3). The steps for managing the cluster using the eG admin interface are discussed elaborately in How to Monitor the Kubernetes/OpenShift Cluster Using eG Enterprise? Whenever the eG agent runs this test, it uses the IP address that is displayed (by default) against this parameter to connect to the Kubernetes API. If there is any change in this IP address at a later point in time, then make sure that you update this parameter with it, by overriding its default setting. |
|
K8s Cluster API Prefix |
By default, this parameter is set to none. Do not disturb this setting if you are monitoring a Kubernetes/OpenShift Cluster. To run this test and report metrics for Rancher clusters, the eG agent needs to connect to the Kubernetes API on the master node of the Rancher cluster and run API commands. The Kubernetes API of Rancher clusters is of the default format: http(s)://{IP Address of kubernetes}/{api endpoints}. The Server section of the kubeconfig.yaml file downloaded from the Rancher console helps in identifying the Kubernetes API of the cluster. For e.g., https://{IP address of Kubernetes}/k8s/clusters/c-m-bznxvg4w/ is usually the URL of the Kubernetes API of a Rancher cluster. For the eG agent to connect to the master node of a Rancher cluster and pull out metrics, the eG agent should be made aware of the API endpoints in the Kubernetes API of the Rancher cluster. To aid this, you can specify the API endpoints available in the Kubernetes API of the Rancher cluster against this parameter. In our example, this parameter can be specified as: /k8s/clusters/c-m-bznxvg4w/. |
|
SSL |
By default, the Kubernetes/OpenShift cluster is SSL-enabled. This is why, the eG agent, by default, connects to the Kubernetes API via an HTTPS connection. Accordingly, this flag is set to Yes by default. If the cluster is not SSL-enabled in your environment, then set this flag to No. |
|
Authentication Token |
The eG agent requires an authentication bearer token to access the Kubernetes API, run API commands on the cluster, and pull metrics of interest. The steps for generating this token have been detailed in How Does eG Enterprise Monitor a Kubernetes/OpenShift Cluster?
Typically, once you generate the token, you can associate that token with the target Kubernetes/OpenShift cluster, when manually adding that cluster for monitoring using the eG admin interface. The steps for managing the cluster using the eG admin interface are discussed elaborately in How to Monitor the Kubernetes/OpenShift Cluster Using eG Enterprise? By default, this parameter will display the Authentication Token that you provided in the Kubernetes Cluster Preferences page of the eG admin interface, when manually adding the cluster for monitoring (see Figure 3). Whenever the eG agent runs this test, it uses the token that is displayed (by default) against this parameter for accessing the API and pulling metrics. If for any reason, you generate a new authentication token for the target cluster at a later point in time, then make sure you update this parameter with the change. For that, copy the new token and paste it against this parameter. |
|
Report System Namespace |
The kube-system namespace consists of all objects created by the Kubernetes system. Monitoring such a namespace may not only increase the eG agent's processing overheads, but may also clutter the eG database. Therefore, to optimize agent performance and to conserve database space, this test, by default, excludes the kube-system namespace from monitoring. Accordingly, this flag is set to No by default. If required, you can set this flag to Yes, and enable monitoring of the kube-system namespace. |
|
Proxy Host |
If the eG agent connects to the Kubernetes API on the master node via a proxy server, then provide the IP address of the proxy server here. If no proxy is used, then the default setting -none - of this parameter, need not be changed, |
|
Proxy Port |
If the eG agent connects to the Kubernetes API on the master node via a proxy server, then provide the port number at which that proxy server listens here. If no proxy is used, then the default setting -none - of this parameter, need not be changed, |
|
Proxy Username, Proxy Password, Confirm Password |
These parameters are applicable only if the eG agent uses a proxy server to connect to the Kubernetes/OpenShift cluster, and that proxy server requires authentication. In this case, provide a valid user name and password against the Proxy Username and Proxy Password parameters, respectively. Then, confirm the password by retyping it in the Confirm Password text box. If no proxy server is used, or if the proxy server used does not require authentication, then the default setting - none - of these parameters, need not be changed. |
|
DD Frequency |
Refers to the frequency with which detailed diagnosis measures are to be generated for this test. The default is 1:1. This indicates that, by default, detailed measures will be generated every time this test runs, and also every time the test detects a problem. You can modify this frequency, if you so desire. Also, if you intend to disable the detailed diagnosis capability for this test, you can do so by specifying none against DD frequency. |
|
Detailed Diagnosis |
To make diagnosis more efficient and accurate, the eG Enterprise embeds an optional detailed diagnostic capability. With this capability, the eG agents can be configured to run detailed, more elaborate tests as and when specific problems are detected. To enable the detailed diagnosis capability of this test for a particular server, choose the On option. To disable the capability, click on the Off option. The option to selectively enable/disable the detailed diagnosis capability will be available only if the following conditions are fulfilled:
|
|
Measurement |
Description |
Measurement Unit |
Interpretation |
||||||||
|---|---|---|---|---|---|---|---|---|---|---|---|
|
Status |
Indicates whether/not the desired state of this deployment is the same as its actual state. |
|
This measure reports the value Healthy if the desired state of the Deployment is the same as its actual state. In other words, if the value of the Total pods with deployment measure is the same as the value of Total available pods with deployment measure, then this measure will report the value Healthy. If not, this measure will report the value Unhealthy. For instance, if the Deployment seeks to deploy a ReplicaSet with 3 replica (Pods) in it, and succeeds in creating such a ReplicaSet, then the value of this measure will be Healthy. On the other hand, if the Deployment created a ReplicaSet with only two available replica Pods, then the value of this measure will be Unhealthy. The numeric values that correspond to these measure values are as follows:
Note: By default, this test reports the Measure Values listed in the table above to indicate the state of a Deployment. In the graph of this measure however, the same is indicated using the numeric equivalents only. |
||||||||
|
Is deployment paused? |
Indicates whether/not this Deployment has been paused. |
|
You can pause a Deployment before triggering one or more updates and then resume it. This allows you to apply multiple fixes in between pausing and resuming without triggering unnecessary rollouts. The values that this measure can report and their corresponding numeric values are listed in the table below:
Note: By default, this test reports the Measure Values listed in the table above to indicate the whether/not a Deployment has been paused. In the graph of this measure however, the same is indicated using the numeric equivalents only. |
||||||||
|
Time since deployment creation |
Indicates how old this Deployment is. |
|
The value of this measure is expressed in number of days, hours, and minutes. You can use the detailed diagnosis of this measure to know the images that a Deployment pulled from the Container Registry to create containers on replica Pods. |
||||||||
|
Is deployment progressing? |
Indicates whether/not this Deployment is in progress. |
|
A Deployment enters various states during its lifecycle. Kubernetes marks a Deployment as progressing when one of the following tasks is performed:
Kubernetes marks a Deployment as complete when it has the following characteristics:
Your Deployment may get stuck trying to deploy its newest ReplicaSet without ever completing. This can occur due to some of the following factors:
Typically, a Deployment is considered to have Failed, if it is making progress for a duration beyond the progressDeadlineSeconds configuration. This measure reports the value Yes for a Deployment, if it is in the progressing or complete state. The value No is reported, if the Deployment is in fail to progress state. The value Unknown is reported if the Deployment is not in any of the above-mentioned states - i.e., if the state cannot be determined. The numeric values that correspond to these measure values are as follows:
Note: By default, this test reports the Measure Values listed in the table above to indicate whether/not a Deployment is progressing. In the graph of this measure however, the same is indicated using the numeric equivalents only. |
||||||||
|
Is deployment available? |
Indicates whether/not this Deployment is available. |
Number |
A deployment is said to be Available, if it has minimum availability. Minimum availability is dictated by the parameters specified in the deployment strategy. For instance, if the default Rolling Update strategy is used, then the Max Unavailable parameter of the strategy indicates the Minimum Availability during an upgrade. For example, if the Max Unavailable is set to 25% , then it means that a minimum of 75% of Pods should be available in the Deployment when an update is in progress. The numeric values that correspond to these measure values are as follows:
Note: By default, this test reports the Measure Values listed in the table above to indicate whether/not a Deployment is Available. In the graph of this measure however, the same is indicated using the numeric equivalents only. If the value of this measure for any Deployment is No, then you can use the detailed diagnosis of this measure to identify the unavailable Pods in the Deployment, and the reason for their unavailability. A Pod is said to be Available, if it is ready without any containers crashing for at least the duration configured against minReadySeconds in the Pod specification. Any Pod that is not ready, or is ready but has containers crashing for a period of time beyond the minReadySeconds duration, is automatically considered Unavailable. |
||||||||
|
Is deployment replica failure? |
Indicates whether/not any replica in this Deployment has failed. |
|
The value Yes for this measure, indicates that one/more replicas in the Deployment could not be created. The value No indicates that all replicas were created. The value Unknown implies that the state of the replicas could not be determined. The numeric values that correspond to these measure values are as follows:
Note: By default, this test reports the Measure Values listed in the table above to indicate whether/not any replicas in the Deployment could not be created. In the graph of this measure however, the same is indicated using the numeric equivalents only. If the failure of one/more replicas causes a a mismatch between the desired state and actual state of the Deployment, then the value of the Status measure of that Deployment will change to Unhealthy. |
||||||||
|
Observed generations |
Indicates the generation observed after this Deployment. |
Number |
A generation is a sequence number representing a specific generation of the desired state. If the value of this measure for a Deployment matches with the desired generation sequence number of that Deployment, it implies that the Deployment is complete. If it does not match, then it means that a Deployment is progressing or has failed. In other words, if the value of the Is progressing? measure for a Deployment is Yes or No, then it means that the desired generation sequence number and the observed generation sequence number of that Deployment is not the same. |
||||||||
|
Replicas |
Indicates the desired number of non-terminated Pod replicas targeted by this Deployment. |
Number |
|
||||||||
|
Updated replicas |
Indicates the total number of non-terminated Pod replicas that have been updated by this Deployment with changes (if any) made to the Pod template specification. |
Number |
Typically, whenever changes are made to a Deployment's Pod template - say, labels or container images of the template are changed - then a Deployment rollout is triggered. A new ReplicaSet is created and the Deployment manages moving the Pods from the old ReplicaSet to the new one at a controlled rate. Ideally, the value of this measure should be the same as the value of the Total pods with deployment measure. If not, then it means that the desired number of Pod replicas are not yet fully updated with the changes to the Pod template. |
||||||||
|
Ready replicas |
Indicates the number of ready Pods created by this Deployment. |
Number |
|
||||||||
|
Total available pods |
Indicates the number of available Pods created by this Deployment. |
Number |
A Pod is said to be Available, if it is ready without any containers crashing for at least the duration configured against minReadySeconds in the Pod specification. Ideally, the value of this measure should be the same as the value of the Total pods with deployment measure. If not, then the Status measure of this test will report the value Unhealthy. This means that the desired state of the Deployment is not the same as its actual state. |
||||||||
|
Total unavailable pods |
Indicates the total number of unavailable Pods created by this Deployment. |
Number |
Any Pod that is not ready, or is ready but has containers crashing for a period of time beyond the minReadySeconds duration, is automatically considered Unavailable. Ideally, the value of this measure should be 0. If this measure reports a non-zero value or a value equal to or close to the value of the Total pods with deployment measure, then the Status measure of this test will report the value Unhealthy. This means that the desired state of the Deployment is not the same as its actual state. In the event that this measure reports a non-zero value, then use the detailed diagnosis of this measure to identify the unavailable Pod replicas in the Deployment. |
||||||||
|
Collision count |
Indicates the count of hash collisions for this deployment. |
Number |
The Deployment controller uses this field as a collision avoidance mechanism when it needs to create the name for the newest ReplicaSet. |
||||||||
|
Pods for this deployment |
Indicates the number of Pods created by this Deployment that are currently running. |
Number |
To know which Pods created by this Deployment are currently running, use the detailed diagnosis of this measure. |
||||||||
|
Retain old replica count |
Indicates the number of old Replica Sets that this Deployment should retain to allow rollback. |
Number |
A Deployment’s revision history is stored in the ReplicaSets it controls. When configuring a Deployment, you can optionally specify .spec.revisionHistoryLimit, where you can indicate the number of old ReplicaSets to retain to allow rollback. This value is reported as the value of this measure. Old ReplicaSets consume resources in etcd and crowd the output of kubectl get rs. The configuration of each Deployment revision is stored in its ReplicaSets; therefore, once an old ReplicaSet is deleted, you lose the ability to rollback to that revision of Deployment. By default, 10 old ReplicaSets will be kept, however its ideal value depends on the frequency and stability of new Deployments. More specifically, setting this field to zero means that all old ReplicaSets with 0 replicas will be cleaned up. In this case, a new Deployment rollout cannot be undone, since its revision history is cleaned up. |
||||||||
|
Pods added recently to namespace |
Indicates the number of Pods that were added to this Deployment during the last measurement period. |
Number |
Use the detailed diagnosis of this measure to identify the name of each Pod that was recently added, the IP address of each Pod, the Node to which each Pod is associated with and the IP address of the Node. |
||||||||
|
Pods recently removed from the namespace |
Indicates the number of Pods that were removed from this Deployment during the last measurement period. |
Number |
Use the detailed diagnosis of this measure to identify the name of each Pod that was recently removed, the IP address of each Pod, the Node to which each Pod is associated with and the IP address of the Node. |
||||||||
|
Total available deployments in namespace |
Indicates the total number of Deployments available in the namespace. |
Number |
This measure is reported only for the Summary descriptor of each namespace discovered by this test. Use the detailed diagnosis of this measure to identify the name of the Deployments that are available. |
||||||||
|
Total unavailable deployments in namespace |
Indicates the total number of Deployments that are unavailable in the namespace. |
Number |
This measure is reported only for the Summary descriptor of each namespace discovered by this test. Use the detailed diagnosis of this measure to identify the name of the Deployments that are unavailable. |
||||||||
|
CPU usage |
Indicates the amount of CPU resources consumed by the pods in this deployments. |
Millicpu |
A high value for this measure indicates that the namespace is consuming more CPU resources that it should. |
||||||||
|
CPU limits |
Indicates that maximum amount of CPU resources that the pods in this deployment can use. |
Millicpu |
|
||||||||
|
CPU requests |
Indicates the minimum CPU resources guaranteed to the pods in this deployment. |
Millicpu |
|
||||||||
|
CPU throttled as percent of Node CPU configured |
Indicates the percentage of the node's total CPU capacity that has been throttled due to CPU limits set on the containers within the deployments in this namespace. |
Percent |
This metrics helps in understanding which deployments are not just overusing their limits but also impacting node-level CPU availability. |
||||||||
|
CPU slack |
Indicates the total amount of CPU resources that are available but not currently requested or used by the pods managed by this deployment. |
Millicpu |
This measure helps to ensure that resource limits and requests for pods in a deployment are configured optimally. |
||||||||
|
Memory usage |
Indicates the amount of memory resources consumed by the pods in this deployments. |
GB |
A low value is cause for concern as it indicates memory contention. |
||||||||
|
Memory limits |
Indicates the maximum amount of memory resources that the pods in this deployment can use. |
GB |
The memory limit is the maximum amount of memory that a container within a pod is allowed to use. If a container exceeds this memory limit, it will be terminated (OOMKilled) and possibly restarted, depending on the pod's restart policy. |
||||||||
|
Memory requests |
Indicates the minimum memory resources guaranteed to the pods in this deployment. |
GB |
If a pod's memory usage is within its memory request, it is less likely to be evicted due to memory pressure. |
||||||||
|
Memory slack |
Indicates the amount of memory available but not yet requested by any pods managed by this deployment. |
GB |
This measure helps to ensure that resource limits and requests for pods in a deployment are configured optimally. |
||||||||
|
CPU throttled |
Indicates the amount of CPU time that was throttled due to containers exceeding their configured CPU limits within this deployment in this namespace. |
Millicpu |
This measure helps to identify deployments where containers regularly exceed their CPU limits and are being throttled. |
You can use the detailed diagnosis of the Age measure to know the images that a Deployment pulled from the Container Registry to create containers on replica Pods.
.png)
Figure 1 : The detailed diagnosis of the Age measure of the Deployments by Namespace test
If the value of the Is available? measure for any Deployment is No, then you can use the detailed diagnosis of this measure to identify the unavailable Pods in the Deployment, and the reason for their unavailability. A Pod is said to be Available, if it is ready without any containers crashing for at least the duration configured against minReadySeconds in the Pod specification. Any Pod that is not ready, or is ready but has containers crashing for a period of time beyond the minReadySeconds duration, is automatically considered Unavailable.
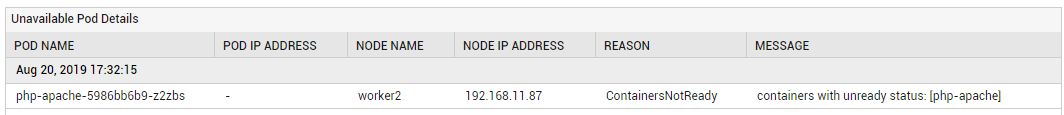
Figure 2 : The detailed diagnosis of the Is available? measure reported by the Deployments by Namespace test
In the event that the Total unavailable pods with deployment measure reports a non-zero value, then use the detailed diagnosis of this measure to identify the unavailable Pod replicas in the Deployment. You can also use the detailed diagnostics to figure what could have rendered a Pod unavailable. This information aids troubleshooting.
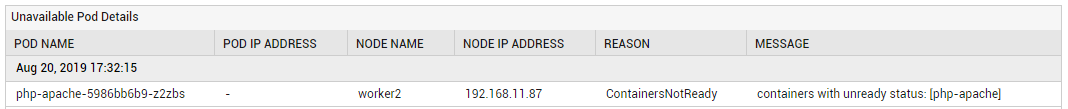
Figure 3 : The detailed diagnosis of the Total unavailable pods with deployment measure