K8s Horizontal Pod Autoscaler by Namespace Test
Horizontal Pod Autoscaling allows you to define rules that will scale the numbers of replicas up or down in deployments, replica sets, or replication controllers, based on CPU utilization and optionally external and custom metrics. For instance, if you have a containerized application that uses up a lot of CPU under load, then you can configure a Horizonal Pod Autoscaler to automatically scale up the Deployment, so that additional replicas of this application (Pod) are automatically created to provide extra capacity when CPU utilization exceeds a target level. Likewise, you can configure the Horizonal Pod Autoscaler to scale down a Deployment, so that replica Pods are automatically terminated to release CPU resources when actual CPU utilization drops below a target level.
Typically, when creating a horizontal autoscaler, you can specify the target utilization value of the metric - this can be a raw value or an average value. Optionally, you can also specify the following:
- The maximum number of replicas the autoscaler can scale up to;
- The minimum number of replicas the autoscaler can scale down to
Whenever the autoscaler runs, the controller manager obtains the actual metrics from the resource metrics API (for per-pod resource metrics), or the custom metrics API (for metrics other than CPU and memory that are associated with a Pod), or the external metrics API (for metrics that are not associated with any object in the Kubernetes system - e.g., an external queuing system, such as the AWS SQS service), as the case may be. Then, it does the following:
- For per-pod resource metrics (like CPU), the controller fetches the metrics from the resource metrics API for each Pod targeted by the HorizontalPodAutoscaler. Then, if a target utilization value is set, the controller calculates the utilization value as a percentage of the equivalent resource request on the containers in each pod. If a target raw value is set, the raw metric values are used directly. The controller then takes the mean of the utilization or the raw value (depending on the type of target specified) across all targeted pods, and produces a ratio, which will be used to scale the number of desired replicas.
- For per-pod custom metrics, the controller functions similarly to per-pod resource metrics, except that it works with raw values, not utilization values.
-
For object metrics and external metrics, a single metric is fetched, which describes the object in question. This metric is compared to the target value, to produce a ratio as above.
If actual resource usage exceeds the targeted value, then the autoscaler uses the ratio it computes to scale up the replicas. On the other hand, if the actual resource usage falls below the targeted value, then the autoscaler uses the ratio it computes to scale down.
The efficiency of the autoscaler therefore relies on the successful computation of scales by the autoscaler, and how prudently you set the scaling limits (i.e., the minimum and maximum replica count for the autoscaler) and the target utilization values. Sometimes, the autoscaler may fail to compute scales. At some other times, user errors may restrict scalability or environmental issues may prevent scaling from even happening. At such times, the success of scaling hinges on the administrator's ability to promptly detect, diagnose, and fix the bottlenecks to scaling. With the Horizonal Pod Autoscaler by Namespaces test, administrators have the ability to achieve the above!
The test auto-discovers the Horizonal Pod autoscalers defined in each namespace. For each autoscaler in a namespace, the test then reports whether/not that autoscaler can actually perform scaling, reveals if its scalability is constricted by its configuration, and alerts administrators if the autoscaler is unable to compute the scales on kubernetes. This way, the test enables administrators promptly capture problems impeding efficient autoscaling. If minimum and maximum replica counts were specified as part of the autoscaler definition, then the test also reports these numbers, so administrators can quickly figure out if changing these values can enhance scalability. Moreover, by enabling administrators to track current CPU utilization levels alongside the target utilization levels, the test not only helps them compute the scaling ratio themselves, but also helps them figure out if the target needs to be reset. Furthermore, by reporting the desired and current replica counts, the test reveals to administrators whether/not the autoscaler has successfully scaled up the replica count to the desired level.
Target of the test : A Kubernetes/OpenShift Cluster
Agent deploying the test : A remote agent
Outputs of the test : One set of results for each autoscaler in each namespace of the Kubernetes/OpenShift cluster being monitored
| Parameter | Description |
|---|---|
|
Test Period |
How often should the test be executed. |
|
Host |
The IP address of the host for which this test is to be configured. |
|
Port |
Specify the port at which the specified Host listens. By default, this is 6443. |
|
Load Balancer / Master Node IP |
To run this test and report metrics, the eG agent needs to connect to the Kubernetes API on the master node and run API commands. To enable this connection, the eG agent has to be configured with either of the following:
By default, this parameter will display the Load Balancer / Master Node IP that you configured when manually adding the Kubernetes/OpenShift cluster for monitoring, using the Kubernetes Cluster Preferences page in the eG admin interface (see Figure 3). The steps for managing the cluster using the eG admin interface are discussed elaborately in How to Monitor the Kubernetes/OpenShift Cluster Using eG Enterprise? Whenever the eG agent runs this test, it uses the IP address that is displayed (by default) against this parameter to connect to the Kubernetes API. If there is any change in this IP address at a later point in time, then make sure that you update this parameter with it, by overriding its default setting. |
|
K8s Cluster API Prefix |
By default, this parameter is set to none. Do not disturb this setting if you are monitoring a Kubernetes/OpenShift Cluster. To run this test and report metrics for Rancher clusters, the eG agent needs to connect to the Kubernetes API on the master node of the Rancher cluster and run API commands. The Kubernetes API of Rancher clusters is of the default format: http(s)://{IP Address of kubernetes}/{api endpoints}. The Server section of the kubeconfig.yaml file downloaded from the Rancher console helps in identifying the Kubernetes API of the cluster. For e.g., https://{IP address of Kubernetes}/k8s/clusters/c-m-bznxvg4w/ is usually the URL of the Kubernetes API of a Rancher cluster. For the eG agent to connect to the master node of a Rancher cluster and pull out metrics, the eG agent should be made aware of the API endpoints in the Kubernetes API of the Rancher cluster. To aid this, you can specify the API endpoints available in the Kubernetes API of the Rancher cluster against this parameter. In our example, this parameter can be specified as: /k8s/clusters/c-m-bznxvg4w/. |
|
SSL |
By default, the Kubernetes/OpenShift cluster is SSL-enabled. This is why, the eG agent, by default, connects to the Kubernetes API via an HTTPS connection. Accordingly, this flag is set to Yes by default.
If the cluster is not SSL-enabled in your environment, then set this flag to No. |
|
Authentication Token |
The eG agent requires an authentication bearer token to access the Kubernetes API, run API commands on the cluster, and pull metrics of interest. The steps for generating this token have been detailed in How Does eG Enterprise Monitor a Kubernetes/OpenShift Cluster?
Typically, once you generate the token, you can associate that token with the target Kubernetes/OpenShift cluster, when manually adding that cluster for monitoring using the eG admin interface. The steps for managing the cluster using the eG admin interface are discussed elaborately in How to Monitor the Kubernetes/OpenShift Cluster Using eG Enterprise? By default, this parameter will display the Authentication token that you provided in the Kubernetes Cluster Preferences page of the eG admin interface, when manually adding the cluster for monitoring (see Figure 3). Whenever the eG agent runs this test, it uses the token that is displayed (by default) against this parameter for accessing the API and pulling metrics. If for any reason, you generate a new authentication token for the target cluster at a later point in time, then make sure you update this parameter with the change. For that, copy the new token and paste it against this parameter. |
|
Proxy Host |
If the eG agent connects to the Kubernetes API on the master node via a proxy server, then provide the IP address of the proxy server here. If no proxy is used, then the default setting -none - of this parameter, need not be changed, |
|
Proxy Port |
If the eG agent connects to the Kubernetes API on the master node via a proxy server, then provide the port number at which that proxy server listens here. If no proxy is used, then the default setting -none - of this parameter, need not be changed, |
|
Proxy Username, Proxy Password, Confirm Password |
These parameters are applicable only if the eG agent uses a proxy server to connect to the Kubernetes/OpenShift cluster, and that proxy server requires authentication. In this case, provide a valid user name and password against the Proxy Username and Proxy Password parameters, respectively. Then, confirm the password by retyping it in the Confirm Password text box. If no proxy server is used, or if the proxy server used does not require authentication, then the default setting - none - of these parameters, need not be changed. |
|
DD Frequency |
Refers to the frequency with which detailed diagnosis measures are to be generated for this test. The default is 1:1. This indicates that, by default, detailed measures will be generated every time this test runs, and also every time the test detects a problem. You can modify this frequency, if you so desire. Also, if you intend to disable the detailed diagnosis capability for this test, you can do so by specifying none against DD frequency. |
|
Detailed Diagnosis |
To make diagnosis more efficient and accurate, the eG Enterprise embeds an optional detailed diagnostic capability. With this capability, the eG agents can be configured to run detailed, more elaborate tests as and when specific problems are detected. To enable the detailed diagnosis capability of this test for a particular server, choose the On option. To disable the capability, click on the Off option. The option to selectively enable/disable the detailed diagnosis capability will be available only if the following conditions are fulfilled:
|
| Measurement | Description | Measurement Unit | Interpretation | ||||||||
|---|---|---|---|---|---|---|---|---|---|---|---|
|
Time since HPA creation |
Indicates the age of this autoscaler. |
|
The value of this measure is expressed in number of days, hours, and minutes. |
||||||||
|
Is able to scale? |
Indicates whether/not this autoscaler is allowed to scale. |
|
This measure reports the value Yes if the autoscaler is able to fetch and update scales. The value No is reported if backoff conditions - eg., a CrashLoopBackOff that is causing a Pod to start and crashing in a loop - are preventing scaling. The value Unknown is reported if the state cannot be determined. The numeric values that correspond to these measure values are as follows:
Note: By default, this test reports the Measure Values listed in the table above to indicate whether/not an autoscaler is allowed to scale. In the graph of this measure however, the same is indicated using the numeric equivalents only. If this measure reports the value No or Unknown, then use the detailed diagnosis of this measure to know what prevented the autoscaler from performing scaling. |
||||||||
|
Is scaling active? |
Indicates whether/not this autoscaler is enabled and is able to calculate the desired scales. |
|
This measure reports the value Yes if the autoscaler is able to fetch metrics and compute the scales. The value No is reported if there are problems with fetching metrics. The value Unknown is reported if the state cannot be determined. The numeric values that correspond to these measure values are as follows:
Note: By default, this test reports the Measure Values listed in the table above to indicate whether/not an autoscaler is able to fetch metrics. In the graph of this measure however, the same is indicated using the numeric equivalents only. If this measure reports the value No or Unknown, then use the detailed diagnosis of this measure to know why the autoscaler could not fetch metrics. |
||||||||
|
Is scaling limited? |
Indicates whether/not this autoscaler's ability to scale is restricted by a maximum / minimum replica count specification. |
|
This measure reports the value Yes if you have to raise or lower the minimum or maximum replica count for the autoscaler to perform scaling. The value No is reported if the requested scaling is allowed. The value Unknown is reported if the state cannot be determined. The numeric values that correspond to these measure values are as follows:
Note: By default, this test reports the Measure Values listed in the table above to indicate whether/not an autoscaler is restricted by its minimum/maximum replica count specification. In the graph of this measure however, the same is indicated using the numeric equivalents only. If this measure reports the value No or Unknown, then use the detailed diagnosis of this measure to know why the autoscaler could not scale. |
||||||||
|
Minimum replicas |
Shows the lower limit for the number of Pods that can be set by this autoscaler. (Default: 1) |
Number |
If the value of this measure is the same as that of the Current replicas measure, then the autoscaler will not be able to scale down until the minimum replica count is decreased in the autoscaler definition. Under such circumstances, you will find that the Is scaling limited? measure reports the value Yes. |
||||||||
|
Maximum replicas |
Shows the upper limit for the number of pods that can be set by this autoscaler. |
Number |
The value of this measure cannot be lesser than the value of the Minimum replicas measure. If the value of this measure is the same as that of the Current replicas measure, then the autoscaler will not be able to scale up until the maximum replica count is increased in the autoscaler definition. Under such circumstances, you will find that the Is scaling limited? measure reports the value Yes |
||||||||
|
Target CPU utilization |
Indicates the target average CPU utilization (represented as a percentage of requested CPU) set for this autoscaler. |
Percent |
If a target utilization is not set in the autoscaler's definition, then the default autoscaling policy will be used. |
||||||||
|
Current CPU utilization |
Indicates the actual average CPU utilization across all Pods targeted by this autoscaler. |
Percent |
If the value of this measure is greater than that of the Target CPU utilization measure, the autoscaler will automatically scale up the replica Pod count to the desired level or up to the maximum replica count (whichever limit is reached first). If the value of this measure is lesser than that of the Target CPU utilization measure, the autoscaler will automatically scale down the replica pod count to the desired level or up to the minimum replica count (whichever limit is reached first). |
||||||||
|
Desired replicas |
Indicates the number of replicas up to which this autoscaler can scale up or scale down. |
Number |
|
||||||||
|
Current replicas |
Indicates the number of replicas currently managed by this autoscaler. |
Number |
If the value of this measure is not equal to that of the Desired replicas measure, it could mean one of the following:
In the case of the former, you will have to investigate the reasons for the failure. In the case of the latter, check the value of the Minimum replicas and Maximum replicas measures and see if changing them will improve scalability of the autoscaler. |
If the Is scaling active? measure reports the value No or Unknown, then use the detailed diagnosis of this measure to know why the autoscaler could not fetch metrics.
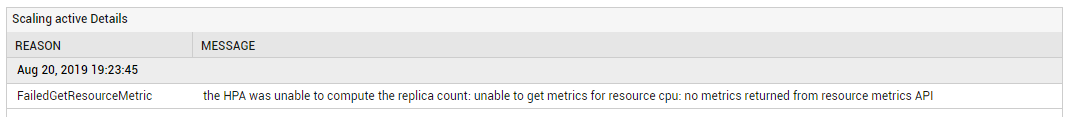
Figure 1 : The detailed diagnosis of the Is scaling active? measure