K8s Cluster Overview Test
A Kubernetes/OpenShift cluster is a set of machines, called nodes, that run containerized applications managed by Kubernetes/OpenShift. A cluster has at least one worker node and at least one master node.
The worker node(s) host the pods that are the components of the application. The master node(s) manages the worker nodes and the pods in the cluster. Multiple master nodes are used to provide a cluster with failover and high availability.
The kube-scheduler schedules Pods to a node, based on the resource capacity of the node and the resource requirements of the containers in the Pods. To ensure that no Pod hogs the node's resources, resource requests and limits can be set per container.
At any given point in time, an administrator needs to have a macro view of the composition of their Kubernetes/OpenShift cluster - i.e., the number of nodes and Pods in the cluster - and the operational state of the nodes and Pods. This will help them quickly spot nodes and Pods that have failed - i.e., it will help them quickly detect a mismatch between the actual state of the cluster and its desired state. By taking appropriate action on such mismatches, administrators can prevent any adverse impact on the availability and performance of containerized applications. Additionally, administrators also need to track how the Pods are utilizing the cluster's compute resources. This way, they can proactively detect probable resource contentions / over-subscriptions, and rapidly initiate measures to right-size the cluster components (i.e., Pods and containers), so that application performance is not affected by resource crunches. Administrators also require an overview of Deployments across the cluster, so that they can easily locate problem areas. The Kube Cluster Overview test provides administrators with all these useful high-level insights!
This test monitors a Kubernetes/OpenShift cluster, reports the total count of nodes in the cluster, and also precisely pinpoints the master and worker nodes of the cluster. The test also tracks the Pod capacity of the cluster alongside Pod allocations, and additionally highlights Pods and nodes in an abnormal state. This enables administrators to rapidly detect any glaring mismatch between the desired state and actual state of the cluster and initiate appropriate remedial measures. Furthermore, the test reveals how the Pods in the cluster are utilizing the cluster's compute resource capacity. In the process, the test brings to light irregularities such as resource over-subscription and current/potential resource contention. Detailed diagnostics provided by the test lead administrators to the exact Pods that are hogging cluster resources, or have been poorly sized. This way, the test points administrators to those Pods for which resource allocations need to be fine-tuned to ensure optimal cluster performance. In addition, the test helps administrators easily compare the desired state of Deployments with the actual state, so that they can instantly capture and resolve discrepancies (if any).
Target of the test : A Kubernetes/OpenShift Cluster
Agent deploying the test : A remote agent
Outputs of the test : One set of results for the Kubernetes/OpenShift cluster being monitored
| Parameter | Description |
|---|---|
|
Test Period |
How often should the test be executed. |
|
Host |
The IP address of the host for which this test is to be configured. |
|
Port |
Specify the port at which the specified Host listens. By default, this is 6443. |
|
Load Balancer / Master Node IP |
To run this test and report metrics, the eG agent needs to connect to the Kubernetes API on the master node and run API commands. To enable this connection, the eG agent has to be configured with either of the following:
By default, this parameter will display the Load Balancer / Master Node IP that you configured when manually adding the Kubernetes/OpenShift cluster for monitoring, using the Kubernetes Cluster Preferences page in the eG admin interface (see Figure 3). The steps for managing the cluster using the eG admin interface are discussed elaborately in How to Monitor the Kubernetes/OpenShift Cluster Using eG Enterprise? Whenever the eG agent runs this test, it uses the IP address that is displayed (by default) against this parameter to connect to the Kubernetes API. If there is any change in this IP address at a later point in time, then make sure that you update this parameter with it, by overriding its default setting. |
|
K8s Cluster API Prefix |
By default, this parameter is set to none. Do not disturb this setting if you are monitoring a Kubernetes/OpenShift Cluster. To run this test and report metrics for Rancher clusters, the eG agent needs to connect to the Kubernetes API on the master node of the Rancher cluster and run API commands. The Kubernetes API of Rancher clusters is of the default format: http(s)://{IP Address of kubernetes}/{api endpoints}. The Server section of the kubeconfig.yaml file downloaded from the Rancher console helps in identifying the Kubernetes API of the cluster. For e.g., https://{IP address of Kubernetes}/k8s/clusters/c-m-bznxvg4w/ is usually the URL of the Kubernetes API of a Rancher cluster. For the eG agent to connect to the master node of a Rancher cluster and pull out metrics, the eG agent should be made aware of the API endpoints in the Kubernetes API of the Rancher cluster. To aid this, you can specify the API endpoints available in the Kubernetes API of the Rancher cluster against this parameter. In our example, this parameter can be specified as: /k8s/clusters/c-m-bznxvg4w/. |
|
SSL |
By default, the Kubernetes/OpenShift cluster is SSL-enabled. This is why, the eG agent, by default, connects to the Kubernetes API via an HTTPS connection. Accordingly, this flag is set to Yes by default. If the cluster is not SSL-enabled in your environment, then set this flag to No. |
|
Authentication Token |
The eG agent requires an authentication bearer token to access the Kubernetes API, run API commands on the cluster, and pull metrics of interest. The steps for generating this token have been detailed in How Does eG Enterprise Monitor a Kubernetes/OpenShift Cluster?
Typically, once you generate the token, you can associate that token with the target Kubernetes cluster, when manually adding that cluster for monitoring using the eG admin interface. The steps for managing the cluster using the eG admin interface are discussed elaborately in How to Monitor the Kubernetes/OpenShift Cluster Using eG Enterprise? By default, this parameter will display the Authentication Token that you provided in the Kubernetes Cluster Preferences page of the eG admin interface, when manually adding the cluster for monitoring (see Figure 3). Whenever the eG agent runs this test, it uses the token that is displayed (by default) against this parameter for accessing the API and pulling metrics. If for any reason, you generate a new authentication token for the target cluster at a later point in time, then make sure you update this parameter with the change. For that, copy the new token and paste it against this parameter. |
|
Proxy Host |
If the eG agent connects to the Kubernetes API on the master node via a proxy server, then provide the IP address of the proxy server here. If no proxy is used, then the default setting -none - of this parameter, need not be changed, |
|
Proxy Port |
If the eG agent connects to the Kubernetes API on the master node via a proxy server, then provide the port number at which that proxy server listens here. If no proxy is used, then the default setting -none - of this parameter, need not be changed, |
|
Proxy Username, Proxy Password, Confirm Password |
These parameters are applicable only if the eG agent uses a proxy server to connect to the Kubernetes/OpenShift cluster, and that proxy server requires authentication. In this case, provide a valid user name and password against the Proxy Username and Proxy Password parameters, respectively. Then, confirm the password by retyping it in the Confirm Password text box. If no proxy server is used, or if the proxy server used does not require authentication, then the default setting - none - of these parameters, need not be changed. |
|
DD Frequency |
Refers to the frequency with which detailed diagnosis measures are to be generated for this test. The default is 1:1. This indicates that, by default, detailed measures will be generated every time this test runs, and also every time the test detects a problem. You can modify this frequency, if you so desire. Also, if you intend to disable the detailed diagnosis capability for this test, you can do so by specifying none against DD frequency. |
|
Detailed Diagnosis |
To make diagnosis more efficient and accurate, the eG Enterprise embeds an optional detailed diagnostic capability. With this capability, the eG agents can be configured to run detailed, more elaborate tests as and when specific problems are detected. To enable the detailed diagnosis capability of this test for a particular server, choose the On option. To disable the capability, click on the Off option. The option to selectively enable/disable the detailed diagnosis capability will be available only if the following conditions are fulfilled:
|
| Measurement | Description | Measurement Unit | Interpretation |
|---|---|---|---|
|
Total nodes |
Indicates the total number of nodes in the cluster. |
Number |
|
|
Master nodes |
Indicates the count of master nodes in the cluster. |
Number |
Use the detailed diagnosis of this measure to know which are the master nodes in the cluster. |
|
Worker nodes |
Indicates the number of worker nodes in the cluster. |
Number |
Use the detailed diagnosis of this measure to know which are the worker nodes in the cluster. |
|
Nodes added to cluster |
Indicates the number of nodes that were added to the cluster since the last measurement period. |
Number |
Use the detailed diagnosis of this measure to know which nodes were recently added to the cluster. |
|
Nodes removed from cluster |
Indicates the number of nodes that were removed from the cluster since the last measurement period. |
Number |
Use the detailed diagnosis of this measure to know which nodes were recently removed from the cluster. |
|
Running nodes |
Indicates the number of nodes in the cluster that are currently running. |
Number |
|
|
Not running nodes |
Indicates the number of nodes in the cluster that are not running presently. |
Number |
Use the detailed diagnosis of this measure to know which nodes are not running and why. |
|
Unknown nodes |
Indicates the number of nodes in the cluster that are in the Unknown presently. |
Number |
Use the detailed diagnosis of this measure to know which nodes are in an Unknown state and why. |
|
Pods capacity |
Indicates the maximum number of Pods that can be created on the nodes in the cluster. |
Number |
|
|
Allocated pods |
Indicates the number of Pods that have been scheduled to nodes in the cluster. |
Number |
If the value of this measure is equal to or close to the value of the Pods capacity measure, it indicates that the cluster has or is about to exhaust its capacity. In such a situation, you may want to add more nodes to your cluster or increase the Pod capacity of your cluster. |
|
Running pods |
Indicates the number of Pods in the cluster that are in the Running state currently. |
Number |
If a Pod is in the Running state, it means that the Pod has been bound to a node, and all of the Containers have been created. At least one Container is still running, or is in the process of starting or restarting. Use the detailed diagnosis of this measure to know which Pods are in the Running state. |
|
Pending pods |
Indicates the number of Pods in the cluster that are in the Pending state currently. |
Number |
If a Pod is in the Pending state, it means that the Pod has been accepted by the Kubernetes system, but one or more of the Container images has not been created. This includes time before being scheduled as well as time spent downloading images over the network, which could take a while. If a pod is stuck in Pending it means that it can not be scheduled onto a node. Generally this is because there are insufficient resources of one type or another that prevent scheduling. If this is the case, do the following:
Use the detailed diagnosis of this measure to know which Pods are in the Pending state. |
|
Succeeded pods |
Indicates the number of Pods in the cluster that are in the Succeeded state currently. |
Number |
If a Pod is in the Succeeded state, it means that all Containers in the Pod have terminated in success, and will not be restarted. |
|
Failed pods |
Indicates the number of Pods in the cluster that are in the Failed state currently. |
Number |
If a Pod is in the Failed state, it means that all Containers in the Pod have terminated, and at least one Container has terminated in failure. That is, the Container either exited with non-zero status or was terminated by the system. Use the detailed diagnosis of this measure to know which Pods are in the Failed state. Ideally, the value of this measure should be 0. |
|
Unknown pods |
Indicates the number of Pods in the cluster that are in the Unknown state currently. |
Number |
If a Pod is in the Unknown state, it means that the state of the Pod could not be obtained, probably due to an error in communicating with the host of the Pod. Ideally, the value of this measure should be 0. |
|
Running pods utilization |
Indicates the percentage of Pods in the cluster that are in a Running state currently. |
Percent |
The formula used for computing this measure is as follows: [Running pods/Pods capacity]*100 Ideally, the value of this measure should be high. |
|
Total CPUs |
Indicates the total number of CPU cores supported by the cluster. |
Number |
|
|
CPU capacity |
Indicates the total CPU capacity of the cluster. |
Millicpu |
|
|
CPU requests |
Indicates the minimum CPU resources guaranteed to the Pods in the cluster. |
Millicpu |
This is the sum of CPU requests configured for all containers in all Pods across nodes in the cluster. A request is the amount of that resource that the system will guarantee to a Pod. |
|
CPU limits |
Indicates that maximum amount of CPU resources that the Pods in the cluster can use. |
Millicpu |
This is the sum of CPU limits set for all containers in all Pods across nodes in the cluster. A limit is the maximum amount that the system will allow the Pod to use. |
|
CPU limits allocation |
Indicates what percentage of the CPU capacity of the cluster is allocated as CPU limits to containers. In other words, this is the percentage of a cluster's CPU capacity that the containers are allowed to use. |
Percent |
The formula used for computing this measure is as follows: (CPU limits/CPU capacity)*100 If the value of this measure exceeds 100%, it means that one/more Pods are probably over-subscribing to the capacity of one/more nodes. |
|
CPU requests allocation |
Indicates what percentage of the total CPU capacity of the cluster is set as CPU requests for the containers in the cluster. In other words, this is the percentage of a cluster's CPU capacity that the containers on the cluster are guaranteed to receive. |
Percent |
The formula used for computing this measure is as follows: (CPU requests/CPU capacity )*100 If the value of this measure is unusually high, then you can use the detailed diagnosis of this measure to review the CPU requests configured for each Pod in the cluster. In the process, you can accurately identify the Pod for which the maximum amount of CPU resources in the cluster is guaranteed - i.e., the Pod that is hogging the CPU capacity of the cluster. |
|
Memory capacity |
Indicates the total memory capacity of the cluster. |
GB |
|
|
Memory requests |
Indicates the minimum memory resources guaranteed to the Pods in the cluster. |
GB |
This is the sum of memory requests configured for all containers in all Pods across nodes in the cluster. A request is the amount of that resource that the system will guarantee to the Pod. |
|
Memory limits |
Indicates the maximum amount of memory resources that the Pods in the cluster can use. |
GB |
This is the sum of memory limits set for all containers in all Pods across nodes in the cluster. A limit is the maximum amount that the system will allow the Pod to use. |
|
Memory limits allocation |
Indicates what percentage of the memory capacity of the cluster is allocated as memory limits to containers in the cluster. In other words, this is the percentage of a cluster's memory capacity that the containers on the cluster are allowed to use. |
Percent |
The formula used for computing this measure is as follows: (Memory limits/Memory capacity)*100 If the value of this measure exceeds 100%, it means that one/more Pods are probably over-subscribing to the capacity of one/more nodes in the cluster. |
|
Memory requests allocation |
Indicates what percentage of the total memory capacity of the cluster is set as memory requests for the containers in the cluster. In other words, this is the percentage of a cluster's memory capacity that the containers in the cluster are guaranteed to receive. |
Percent |
The formula used for computing this measure is as follows: (Memory requests/Memory capacity)*100 If the value of this measure is unusually high, then you can use the detailed diagnosis of this measure to review the memory requests configured for each Pod in the cluster. In the process, you can accurately identify the Pod for which the maximum amount of memory resources in the cluster is guaranteed - i.e., the Pod that is hogging the memory capacity of the cluster. |
|
Total pods with updated deployment |
Indicates the total number of non-terminated Pod replicas in the cluster that have been updated with changes (if any) made to Pod template specifications. |
Number |
Typically, whenever changes are made to a Deplopyment's Pod template - say, labels or container images of the template are changed - then a Deployment rollout is triggered. A new ReplicaSet is created and the Deployment manages moving the Pods from the old ReplicaSet to the new one at a controlled rate. Ideally, the value of this measure should be the same as the value of the Total pods with deployment measure. If not, then it means that the desired number of Pod replicas are not yet fully updated with the changes to the Pod template. |
|
Ready pods with deployment |
Indicates the number of ready Pods created in the cluster across Deployments. |
Number |
|
|
Total available pods with deployment |
Indicates the number of available Pods created in the cluster across Deployments. |
Number |
A Pod is said to be Available, if it is ready without any containers crashing for at least the duration configured against minReadySeconds in the Pod specification. Ideally, the value of this measure should be the same as the value of the Total pods with deployment measure. This means that the desired state of the Deployments is not the same as their actual state. |
|
Total unavailable pods with deployment |
Indicates the total number of unavailable Pods created in the cluster across Deployments. |
Number |
Any Pod that is not ready, or is ready but has containers crashing for a period of time beyond the minReadySeconds duration, is automatically considered Unavailable. Ideally, the value of this measure should be 0. If this measure reports a non-zero value or a value equal to or close to the value of the Total pods with deployment measure, it means that the desired state of the Deployments is not the same as their actual state. |
|
App pods count |
Indicates the number of application Pods created in the cluster across Deployments. |
Number |
|
|
System pods count |
Indicates the number of system Pods created in the cluster across Deployments. |
Number |
|
|
Total pods with deployment |
Indicates the total number of Pods created in the cluster across Deployments. |
Number |
|
|
Total CPU usage |
Indicates the total CPU utilization of the cluster. |
Millicpu |
Use the detailed diagnosis of this measure to figure out the CPU utilization of each node in the cluster.
|
|
Average CPU utilization |
Indicates the CPU utilized by the cluster, expressed in percent. |
Percent |
|
|
Total memory usage |
Indicates the total memory utilization of the cluster. |
GB |
Use the detailed diagnosis of this measure to figure out the memory utilized by each node in the cluster.
|
|
Average Memory utilization |
Indicates the memory utilized by the cluster, expressed in percent. |
Percent |
|
|
Total images |
Indicates the total number of images on the cluster. |
Number |
|
|
Total used images |
Indicates the total number of images currently used by the containers on the cluster. |
Number |
The detailed diagnosis of this measure lists the name of the images that are used, the Image ID of each image, the size of each image and the node on which each image resides. |
|
Not used images |
Indicates the number of images still to be used by the containers on the cluster. |
Number |
The detailed diagnosis of this measure lists the name of the images that are unused, the Image ID of each image and the size of each image. |
|
Total images size |
Indicates the total size of images on the cluster. |
GB |
|
|
Nodes with disk pressure condition |
Indicates the number of nodes (on the cluster) that are low on disk capacity. |
Number |
The detailed diagnosis of this measure indicates the name of the nodes that are low on disk capacity, the reason and the message. |
|
Nodes with memory pressure condition |
Indicates the number of nodes (on the cluster) that are running low on memory. |
Number |
The detailed diagnosis of this measure indicates the name of the nodes that are running low on memory, the reason and the message. |
|
Nodes with out of disk condition |
Indciates the number of nodes (on the cluster) that do not have sufficient free disk space to add new Pods. |
Number |
The detailed diagnosis of this measure indicates the name of the nodes that do not have sufficient free disk space to add new Pods, the reason and the message. |
|
Nodes with PID pressure condition |
Indicates the number of nodes (on the cluster) on which too many processes are running. |
Number |
The detailed diagnosis of this measure indicates the name of the nodes on which too many processes are running, the reason and the message. |
|
Nodes with network unavailable condition |
Indicates the number of nodes (on the cluster) on which network is not correctly configured. |
Number |
The detailed diagnosis of this measure indicates the name of the nodes on which network is not correctly configured, the reason and the message. |
|
Total deployments |
Indicates the total number of Deployments in the cluster. |
Number |
|
|
Total services |
Indicates the total number of services in the cluster. |
Number |
|
|
Total daemonsets |
Indicates the total number of daemonsets in the cluster. |
Number |
|
|
Total namespaces |
Indicates the total number of namespaces in the cluster. |
Number |
|
|
Zombie pods |
Indicates the number of Pods in the cluster that are in the Zombie state currently. |
Number |
A Zombie Pod is simply said to be still running, but not doing any “work”. Pods in the zombie state exhibit three symptoms: the Pods had a status of “Running”, the applications stopped writing any log output, and there were no application metrics being sent to Prometheus. Use the detailed diagnosis of this measure to identify the name of the Zombie Pods and the nodes to which the Zombie Pods belong to. |
|
Total statefulsets |
Indicates the total number of StatefuleSets in the cluster. |
Number |
StatefulSet is the workload API object used to manage stateful applications. StatefulSet manages the deployment and scaling of a set of Pods, and provides guarantees about the ordering and uniqueness of these Pods. Like a Deployment, a StatefulSet manages Pods that are based on an identical container spec. Unlike a Deployment, a StatefulSet maintains a sticky identity for each of its Pods. StatefulSets are valuable for applications that require one or more of the following.
|
|
CPU throttled as percent of Node CPU configured |
Indicates the percentage of the node's total CPU capacity that has been throttled due to CPU limits set on the containers within this cluster. |
Percent |
This metric helps to identify resource constraints across the cluster. |
|
CPU slack |
Indicates the total amount of CPU resources that are available but not currently requested or used by any pods in the Kubernetes cluster. |
Millicpu |
This value helps determine how much headroom is available for scheduling new workloads or scaling existing ones. |
|
Memory slack |
Indicates the amount of memory (RAM) in the cluster that is allocatable but not yet requested by any pod across the cluster. |
GB |
This measure shows the unused memory buffer available in the cluster for scheduling and helps understand how close the cluster is to memory saturation or underutilization. |
|
CPU throttled |
Indicates the amount of CPU time that was throttled due to containers exceeding their configured CPU limits within this cluster. |
Millicpu |
This measure helps to identify if workloads across the cluster are consistently hitting their CPU limits, which can indicate under-provisioned resources or overly aggressive CPU limit configurations. |
Use the detailed diagnosis of the Master nodes measure to know which are the master nodes in the cluster.
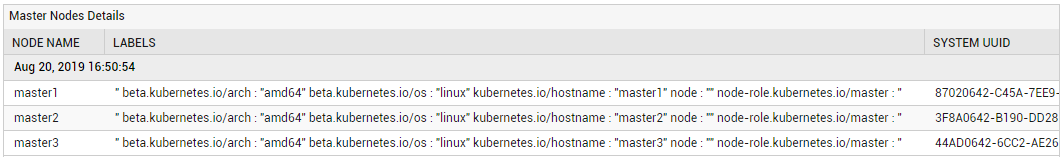
Figure 1 : The detailed diagnosis of the Master nodes measure
Use the detailed diagnosis of the Worker nodes measure to know which are the worker nodes in the cluster.
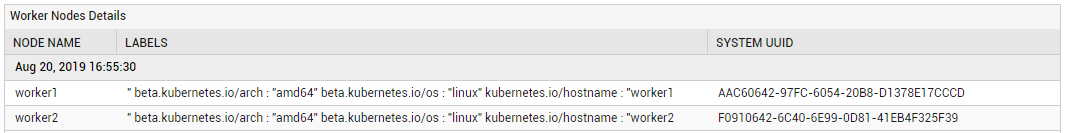
Figure 2 : The detailed diagnosis of the Worker nodes measure
Use the detailed diagnosis of the Nodes added to cluster measure to know which nodes were recently added to the cluster.
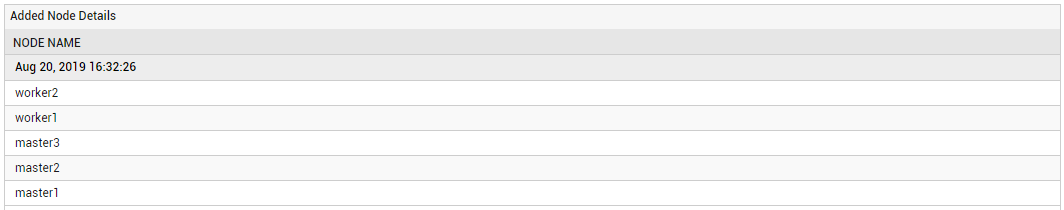
Figure 3 : The detailed diagnosis of the Nodes added to cluster measure
Use the detailed diagnosis of the Nodes removed from cluster measure to know which nodes were recently removed from the cluster.
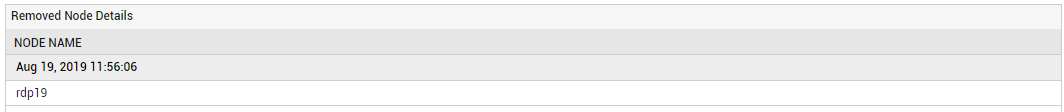
Figure 4 : The detailed diagnosis of the Nodes removed from cluster measure
Use the detailed diagnosis of the Nodes not running measure to know which nodes are not running and why.
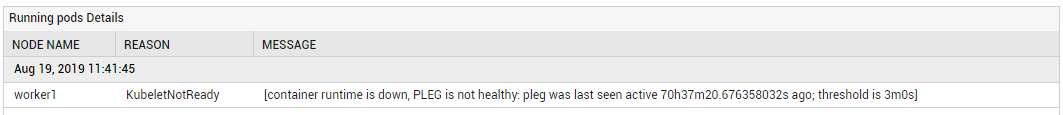
Figure 5 : The detailed diagnosis of the Nodes not running measure
Use the detailed diagnosis of the Unknown nodes measure to know which nodes are in an Unknown state and why.
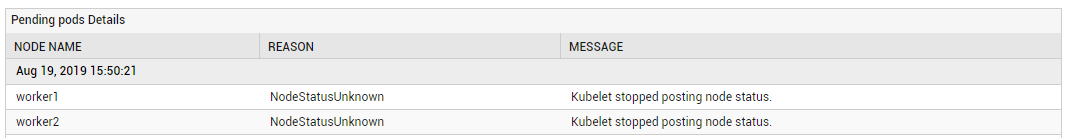
Figure 6 : The detailed diagnosis of the Unknown nodes measure
Use the detailed diagnosis of the Running pods measure to know which Pods are in the Running state and which node each running Pod is scheduled to.
.png)
Figure 7 : The detailed diagnosis of the Running pods measure reported by the Kube Cluster Overview test
Use the detailed diagnosis of the Pending pods measure to know which Pods are in the Pending state and which node each pending Pod is scheduled to.
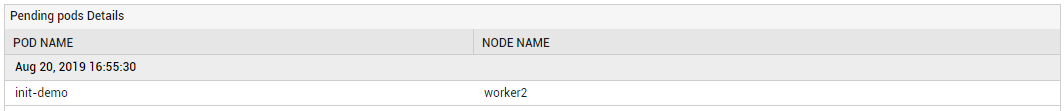
Figure 8 : The detailed diagnosis of the Pending pods measure reported by the Kube Cluster Overview test
If the value of the CPU requests allocation measure is unusually high, then you can use the detailed diagnosis of this measure to review the CPU requests configured for each Pod in the cluster. In the process, you can accurately identify the Pod that is guaranteed to receive the maximum amount of CPU resources in the cluster - i.e., the Pod that is hogging the CPU capacity of the cluster.
.png)
Figure 9 : The detailed diagnosis of the CPU requests allocation measure reported by the Kube Cluster Overview test
If the value of the Memory requests allocation measure is unusually high, then you can use the detailed diagnosis of this measure to review the memory requests configured each Pod in the cluster. In the process, you can accurately identify the Pod that is guaranteed to receive the maximum amount of memory resources in the cluster - i.e., the Pod that is hogging the memory capacity of the cluster.
.png)
Figure 10 : The detailed diagnosis of the Memory request allocation measure reported by the Kube Cluster Overview test