K8s Events Test
Kubernetes events are a resource type in Kubernetes that are automatically created when other resources have state changes, errors, or other messages that should be broadcast to the system. These events are an invaluable resource when debugging issues in a Kubernetes cluster.
Hence, to be able to rapidly detect and troubleshoot issues impacting cluster performance, administrators should keep an eye out for Kubernetes events, and capture these events whenever they are created. The Kube Events test helps administrators achieve this!
This test intercepts Kubernetes events as and when they are created by the Kubernetes system, and brings every such event to the notice of administrators. Such events can point to normal cluster operations - eg., Pod creation, container creation etc., - and also abnormalities such as image pulling failures, scheduling failures etc. Whenever the test alerts administrators to an error or a failure event, administrators can use the detailed diagnostics provided by the test to determine why the error/failure occurred. This can greatly help in troubleshooting problem events.
Target of the test : A Kubernetes/OpenShift Cluster
Agent deploying the test : A remote agent
Outputs of the test : One set of results for the Kubernetes/OpenShift cluster being monitored
| Parameter | Description |
|---|---|
|
Test Period |
How often should the test be executed. |
|
Host |
The IP address of the host for which this test is to be configured. |
|
Port |
Specify the port at which the specified Host listens. By default, this is 6443. |
|
Load Balancer / Master Node IP |
To run this test and report metrics, the eG agent needs to connect to the Kubernetes API on the master node and run API commands. To enable this connection, the eG agent has to be configured with either of the following:
By default, this parameter will display the Load Balancer / Master Node IP that you configured when manually adding the Kubernetes cluster for monitoring, using the Kubernetes Cluster Preferences page in the eG admin interface (see Figure 3). The steps for managing the cluster using the eG admin interface are discussed elaborately in How to Monitor the Kubernetes/OpenShift Cluster Using eG Enterprise? Whenever the eG agent runs this test, it uses the IP address that is displayed (by default) against this parameter to connect to the Kubernetes API. If there is any change in this IP address at a later point in time, then make sure that you update this parameter with it, by overriding its default setting. |
|
K8s Cluster API Prefix |
By default, this parameter is set to none. Do not disturb this setting if you are monitoring a Kubernetes/OpenShift Cluster. To run this test and report metrics for Rancher clusters, the eG agent needs to connect to the Kubernetes API on the master node of the Rancher cluster and run API commands. The Kubernetes API of Rancher clusters is of the default format: http(s)://{IP Address of kubernetes}/{api endpoints}. The Server section of the kubeconfig.yaml file downloaded from the Rancher console helps in identifying the Kubernetes API of the cluster. For e.g., https://{IP address of Kubernetes}/k8s/clusters/c-m-bznxvg4w/ is usually the URL of the Kubernetes API of a Rancher cluster. For the eG agent to connect to the master node of a Rancher cluster and pull out metrics, the eG agent should be made aware of the API endpoints in the Kubernetes API of the Rancher cluster. To aid this, you can specify the API endpoints available in the Kubernetes API of the Rancher cluster against this parameter. In our example, this parameter can be specified as: /k8s/clusters/c-m-bznxvg4w/. |
|
SSL |
By default, the Kubernetes cluster is SSL-enabled. This is why, the eG agent, by default, connects to the Kubernetes API via an HTTPS connection. Accordingly, this flag is set to Yes by default. If the cluster is not SSL-enabled in your environment, then set this flag to No. |
|
Authentication Token |
The eG agent requires an authentication bearer token to access the Kubernetes API, run API commands on the cluster, and pull metrics of interest. The steps for generating this token have been detailed in How Does eG Enterprise Monitor a Kubernetes/OpenShift Cluster?
Typically, once you generate the token, you can associate that token with the target Kubernetes cluster, when manually adding that cluster for monitoring using the eG admin interface. The steps for managing the cluster using the eG admin interface are discussed elaborately in How to Monitor the Kubernetes/OpenShift Cluster Using eG Enterprise? By default, this parameter will display the Authentication Token that you provided in the Kubernetes Cluster Preferences page of the eG admin interface, when manually adding the cluster for monitoring (see Figure 3). Whenever the eG agent runs this test, it uses the token that is displayed (by default) against this parameter for accessing the API and pulling metrics. If for any reason, you generate a new authentication token for the target cluster at a later point in time, then make sure you update this parameter with the change. For that, copy the new token and paste it against this parameter. |
|
Proxy Host |
If the eG agent connects to the Kubernetes API on the master node via a proxy server, then provide the IP address of the proxy server here. If no proxy is used, then the default setting -none - of this parameter, need not be changed, |
|
Proxy Port |
If the eG agent connects to the Kubernetes API on the master node via a proxy server, then provide the port number at which that proxy server listens here. If no proxy is used, then the default setting -none - of this parameter, need not be changed, |
|
Proxy Username, Proxy Password, Confirm Password |
These parameters are applicable only if the eG agent uses a proxy server to connect to the Kubernetes/OpenShift cluster, and that proxy server requires authentication. In this case, provide a valid user name and password against the Proxy Username and Proxy Password parameters, respectively. Then, confirm the password by retyping it in the Confirm Password text box. If no proxy server is used, or if the proxy server used does not require authentication, then the default setting - none - of these parameters, need not be changed. |
|
DD Frequency |
Refers to the frequency with which detailed diagnosis measures are to be generated for this test. The default is 1:1. This indicates that, by default, detailed measures will be generated every time this test runs, and also every time the test detects a problem. You can modify this frequency, if you so desire. Also, if you intend to disable the detailed diagnosis capability for this test, you can do so by specifying none against DD frequency. |
|
Detailed Diagnosis |
To make diagnosis more efficient and accurate, the eG Enterprise embeds an optional detailed diagnostic capability. With this capability, the eG agents can be configured to run detailed, more elaborate tests as and when specific problems are detected. To enable the detailed diagnosis capability of this test for a particular server, choose the On option. To disable the capability, click on the Off option. The option to selectively enable/disable the detailed diagnosis capability will be available only if the following conditions are fulfilled:
|
| Measurement | Description | Measurement Unit | Interpretation |
|---|---|---|---|
|
Terminated all pods in nodes |
Indicates the number of times all the pods in the cluster were terminated during the last measurement period. |
Number |
Use the detailed diagnosis of this measure to know which Pods on which nodes were terminated in which namespace, and why. |
|
Registered nodes |
Indicates the number of nodes that were registered during the last measurement period. |
Number |
|
|
Removing nodes |
Indicates the number of nodes that were gracefully removed/drained during the last measurement period. |
Number |
Draining a node does the following:
Use the detailed diagnosis of this measure to know which nodes were removed/drained from which namespace, and why. |
|
Deleting nodes |
Indicates the number of nodes that were deleted during the last measurement period. |
Number |
Deleting the node object from Kubernetes causes all the Pod objects running on the node to be deleted from the apiserver, and frees up their names. Use the detailed diagnosis of this measure to know which nodes were deleted from which namespace. |
|
Deleting all pods |
Indicates the number of times all Pods on a node were deleted since the last measurement period. |
Number |
Use the detailed diagnosis of this measure to know which Pods were deleted from which nodes in which namespace, and why. |
|
Terminating evicted pods |
Indicates the number of times since the last measurement period, pods were evicted. |
Number |
One of the most useful events to monitor is when a node begins evicting pods. This event happens when a node determines that pods need to be evicted to free up some resource such as CPU, memory, or disk. An eviction can have devastating consequences if the kubelet is unable to determine the best resources to evict. For instance, the kubelet detecting disk pressure may sometimes evict Pods that have no effect on disk usage. The evicted Pods may also get scheduled on other nodes, overloading their other resources and also causing evictions. Knowing when evictions happened, and being able to correlate it with other events in that time frame, can help avoid the issue. You can use the detailed diagnosis of this measure to know which Pods were evicted and when eviction occurred. |
|
Ready nodes |
Indicates the number of times the NodeReady event occurred since the last measurement period. |
Number |
|
|
Nodes not ready |
Indicates the number of times the NodeNotReady event occurred during the last measurement period. |
Number |
Use the detailed diagnosis of this measure to know which nodes were not ready , and when the event occurred. |
|
Nodes are schedulable |
Indicates the number of times the NodeSchedulable event occurred during the last measurement period. |
Number |
Use the detailed diagnosis of this measure to know when this event started, when it ended, and which nodes were found schedulable in the process, and which Pods were scheduled to those nodes. |
|
CIDR not available |
Indicates the number of times the CIDRNotAvailable event occurred during the last measurement period. |
Number |
Kubernetes assigns each node a range of IP addresses, a CIDR block, so that each Pod can have a unique IP address. Use the detailed diagnosis of this measure to know when this event occurred, why, on which nodes, and which Pods were impacted. |
|
CIDR assignments failed |
Indicates the number of times the CIDRAssignmentFailed event occurred during the last measurement period. |
Number |
Use the detailed diagnosis of this measure to know when this event occurred, why, on which nodes, and which Pods were impacted. |
|
Starting kubelets |
Indicates the number of times the Starting event occurred during the last measurement period. |
Number |
|
|
Kubelet setup failed |
Indicates the number of times the KubeletSetupFailed event occurred during the last measurement period. |
Number |
Use the detailed diagnosis of this measure to know when this event occurred, why, on which nodes, and which Pods were impacted. |
|
Volume mounts failed |
Indicates the number of times the FailedMount event occurred during the last measurement period. |
Number |
The FailedMount and FailedAttachVolume events can help you debug issues with storage. These events will prevent Pods from starting correctly. You may think that your Pods are just slow to start, but if there are permissions or networking issues when creating network volumes, you will need to rectify them to get your Pods working again. Use the detailed diagnosis of this measure to know when this event occurred, why, on which nodes, and which Pods were impacted. |
|
Nodes selector mismatch |
Indicates the number of times in the last measurement period, the NodeSelectorMismatching event occurred. |
Number |
You can constrain a Pod to only be able to run on particular Node(s), or to prefer to run on particular nodes. nodeSelector is the simplest recommended form of node selection constraint. nodeSelector is a field of PodSpec. It specifies a map of key-value pairs. For the pod to be eligible to run on a node, the node must have each of the indicated key-value pairs as labels (it can have additional labels as well). The most common usage is one key-value pair. If, when attempting to schedule a Pod, scheduler finds that that Pod's nodeSelector does not have any matching node, the NodeSelectorMismatching event is triggered. In this case, the Pod in question will remain in the Pending state until a matching node is found. . |
|
Node has insufficient free CPU |
Indicates the number of times during the last measurement period the InsufficientFreeCpu event was triggered. |
Number |
If a Pod is stuck in the Pending state, it means that it can not be scheduled onto a node. Generally this is because there are insufficient resources of one type or another that prevent scheduling. The scheduler triggers an InsufficientFreeCpu or an InsufficientFreeMemory event at around such times. In this case you can try several things:
You can use the detailed diagnosis of these measures to identify the nodes on which the events occurred, when it occurred, which Pods were impacted, and why. |
|
Node has insufficient free memory |
Indicates the number of times during the last measurement period the InsufficientFreeMemory event was triggered. |
Number |
|
|
Out of disk in nodes |
Indicates the number of OutofDisk events that occurred during the last measurement period. |
Number |
OutOfDisk indicates that the file system on the worker node is full. Kubernetes begins migrating pods off the node until the situation is fixed and the status of the node moves back to Ready. Use the detailed diagnosis of this measure to know when this event occurred, why, on which nodes, and which Pods were impacted. |
|
Network not supported |
Indicates the number of HostNetworkNotSupported events that occurred during the last measurement period. |
Number |
If you use the host network mode for a container, that container’s network stack is not isolated from the node's (the container shares the host’s networking namespace), and the container does not get its own IP-address allocated. For instance, if you run a container which binds to port 80 and you use host networking, the container’s application is available on port 80 on the node’s IP address. Host mode networking can be useful to optimize performance, and in situations where a container needs to handle a large range of ports, as it does not require network address translation (NAT), and no “userland-proxy” is created for each port. |
|
Undefined shaper |
Indicates the number of times the NilShaper event occurred during the last measurement period. |
Number |
If Pod requests bandwidth shaping, but the shaper is undefined, then this event occurs. |
|
Nodes rebooted |
Indicates the number of times the Rebooted event occurred during the last measurement period. |
Number |
Use the detailed diagnosis of this measure to know which nodes were rebooted, when, why, and which Pods were impacted. |
|
Node has sufficient disk |
Indicates the number of times the NodeHasSufficientDisk event was triggered during the last measurement period. |
Number |
|
|
Nodes out of disk space |
Indicates the number of times the NodeOutofDisk event occurred since the last measurement period. |
Number |
OutOfDisk indicates that the file system on the worker node is full. Kubernetes begins migrating pods off the node until the situation is fixed and the status of the node moves back to Ready. Use the detailed diagnosis of this measure to know when this event occurred, why, on which nodes, and which Pods were impacted. |
|
Invalid disk capacity |
Indicates the number of times the InvalidDiskCapacity event occurred since the last measurement period. |
Number |
Use the detailed diagnosis of this measure to know when this event occurred, why, on which nodes, and which Pods were impacted. |
|
Free disk space failed |
Indicates the number of times the FreeDiskSpaceFailed event occurred during the last measurement period. |
Number |
This event occurs if the host file system is full. One of the common reasons for this is the garbage collector's failure to delete any image.
|
|
Pulling images |
Indicates the number of times the Pulling event occurred during the last measurement period. |
Number |
During the deployment of an application to a Kubernetes cluster, you will typically want one or more images to be pulled from a Docker registry. In the application's manifest file you specify the images to pull, the registry to pull them from, and the credentials to use when pulling the images. Use the detailed diagnosis of this measure to know when this event occurred, which image was being pulled, and which nodes and Pods were impacted by the event. |
|
Images pulled |
Indicates the number of times the Pulled event occurred during the last measurement period. |
Number |
Images are pulled based on the ImagePullPolicy. The default pull policy is IfNotPresent which causes the Kubelet to skip pulling an image if it already exists. If you would like to always force a pull, you can do one of the following:
|
|
Images created |
Indicates the number of times the Created event occurred during the last measurement period. |
Number |
|
|
Images started |
Indicates the number of times the Started event occurred during the last measurement period. |
Number |
|
|
Failed to pull images |
Indicates the number of times the Failed event occurred during the last measurement period. |
Number |
Common causes for failure to pull images are:
Use the detailed diagnosis of this measure to know when this event occurred, why, on which nodes, and which Pods were impacted. |
|
Images neverpull policy violated |
Indicates the number of times during the last measurement period the ErrImageNeverPull event occurred. |
Number |
The never pull policy disables images pulling completely. If this policy is set, then the image is assumed to exist locally. No attempt is made to pull the image. This pull policy should be used if you want or need to have a full control on which images are used. It is a good choice for containers that are dedicated to a project where only specific images can be used. If, when attempting to pull an image, the kubelet finds that the image is not present locally, then this policy is violated. Use the detailed diagnosis of this measure to know when this event occurred, why, on which nodes, and which Pods were impacted. |
|
Back off pulling images |
Indicates the number of times the BackOff event occurred in the last measurement period. |
Number |
This event is triggered, if:
Use the detailed diagnosis of this measure to know when this event occurred, why, on which nodes, and which Pods were impacted. |
|
Containers created |
Indicates the number of times the Created event occurred in the last measurement period. |
Number |
This event is triggered every time a container is created. |
|
Killing containers |
Indicates the number of times the Killing event occurred in the last measurement period. |
Number |
This event is triggered every time a container is killed. Use the detailed diagnosis of this measure to know when this event occurred, why, on which nodes, and which Pods were impacted. |
|
Unhealthy containers |
Indicates the number of times the Unhealthy event occurred in the last measurement period. |
Number |
There is a single main process that is running in a container. Such a process can start other child processes within a container, if necessary. Every such process, including the main process, can have its own lifecycle – but if the main process stops, the container stops as well. A container is healthy, by the most general definition, if its main process is running. If the container’s main process is terminated unexpectedly, then the container is considered unhealthy. Use the detailed diagnosis of this measure to know when this event occurred, why, on which nodes, and which Pods were impacted. |
|
Pods sync failed |
Indicates the number of times the FailedSync event occurred in the last measurement period. |
Number |
Use the detailed diagnosis of this measure to know when this event occurred, why, on which nodes, and which Pods were impacted. |
|
Failed pods config validation |
Indicates the number of times the FailedValidation event occurred in the last measurement period. |
Number |
Use the detailed diagnosis of this measure to know when this event occurred, why, on which nodes, and which Pods were impacted. |
|
Out of disk in pods |
Indicates the number of times the OutOfDisk event occurred in the last measurement period. |
Number |
Sometimes, the container(s) running in a Pod can fill up disk space, triggering an OutOfDisk event. Use the detailed diagnosis of this measure to know when this event occurred, why, on which nodes, and which Pods were impacted. |
|
Host/Port conflict |
Indicates the number of times the HostPortConflict event occurred in the last measurment period. |
Number |
|
|
Pods created |
Indicates the number of times the SuccessfulCreate event occurred in the last measurement period. |
Number |
|
|
Failed replicaset |
Indicates the number of times the FailedCreate event occurred in the last measurement period. |
Number |
This event is triggered if a ReplicationController fails to create Pods. In such a case, use the detailed diagnosis of this measure to know when this event occurred, why, on which nodes, and which Pods were impacted. Typically, if a ReplicationController cannot create Pods, you may have to debug the Pods. The first step in debugging a Pod is taking a look at it. Check the current state of the Pod and recent events: Look at the state of the containers in the Pod. Are they all running? Have there been recent restarts? Then, continue debugging depending on the state of the Pods. Are Pods stuck in a Pending state? Then, check for resource inadequacies. Are the Pods in Waiting state? Then, check if there are any issues in image pulling. Are the Pods crashing? Then, study the container logs for troubleshooting the same. |
|
Pods deleted |
Indicates the number of times the SuccessfulDelete event occurred in the last measurement period. |
Number |
|
|
Pods delete failed |
Indicates the number of times the FailedDelete event occurred in the last measurement period. |
Number |
Use the detailed diagnosis of this measure to know when this event occurred, why, on which nodes, and which Pods were impacted. |
|
Preempting containers |
Indicates the number of times the PreemptContainer event occurred in the last measurement period. |
Number |
|
|
Containers exceeded grace period |
Indicates the number of times the ExceededGracePeriod event occurred in the last measurement period. |
Number |
As part of the graceful termination lifecycle, Kubernetes first sends a SIGTERM signal to the containers in a Pod to let the containers know that they are going to be shut down soon. At this point, Kubernetes waits for a specified time called the termination grace period. This is 30 seconds by default. If the containers in the Pod are still running after the grace period, Kubernetes triggers the ExceededGracePeriod event, and sends the SIGKILL signal to forcibly remove the containers. Use the detailed diagnosis of this measure to know when this event occurred, why, on which nodes, and which Pods were impacted. |
|
Failed to attach volume |
Indicates the number of times the FailedAttachVolume event occurred in the last measurement period. |
Number |
The FailedAttachVolume is an error that occurs when Persistent Volume (PV) is unable to be detached from a node. This means it can no longer be attached to another node and happens because Kubernetes will not force detatch PVs from nodes. In other words, the FailedAttachVolume event is an outcome of a fundamental failure to unmount and detach the volume from the failed node. The FailedMount event typically follows the FailedAttachVolume event because the mount operation happens after the attach operation and because the attach has already failed, it means that the mount operation is not possible. The FailedMount and FailedAttachVolume events can help you debug issues with storage. These events will prevent Pods from starting correctly. You may think that your Pods are just slow to start, but if there are permissions or networking issues when creating network volumes, you will need to rectify them to get your Pods working again. Use the detailed diagnosis of these measures to know when these events occurred, why, on which nodes, and which Pods were impacted. |
|
Failed mount |
Indicates the number of times the FailedMount event occurred in the last measurement period. |
Number |
|
|
Volume resize failed |
Indicates the number of times the VolumeResizeFailed event occurred in the last measurement period. |
Number |
Typically, if a PVC is already attached to a Pod, then resizing that PVC would fail with the VolumeResizeFailed event. In such cases, update the size of the PV, then edit the PVC accordingly, and delete the Pod to get it to the detached state. Then, recreate that Pod. Use the detailed diagnosis of this measure to know when this event occurred, why, on which nodes, and which Pods were impacted. |
|
File system resize failed |
Indicates the number of times the FileSystemResizeFailed event occurred in the last measurement period. |
Number |
This event is triggered if errors are encountered when expanding the file system. Use the detailed diagnosis of this measure to know when this event occurred, why, on which nodes, and which Pods were impacted. |
|
Failed map volume |
Indicates the number of times the FailedMapVolume event occurred in the last measurement period. |
Number |
Use the detailed diagnosis of this measure to know when this event occurred, why, on which nodes, and which Pods were impacted. |
|
Container GC failed |
Indicates the number of times the ContainerGCFailed event occurred in the last measurement period. |
Number |
Typically, whenever Pod eviction thresholds are too close to the node's physical memory limits, one of these events will be triggered. Use the detailed diagnosis of these measures to know when these events occurred, why, on which nodes, and which Pods were impacted. |
|
Image GC failed |
Indicates the number of times the ImageGCFailed event occurred in the last measurement period. |
|
|
|
Failed node allocatable enforcement |
Indicates the number of times the FailedNodeAllocatableEnforcement event occurred in the last measurement period. |
Number |
The kubelet exposes a feature named Node Allocatable that helps to reserve compute resources for system daemons. Allocatable on a Kubernetes node is defined as the amount of compute resources that are available for Pods. To properly enforce node allocatable constraints on the node, you must enable the new cgroup hierarchy via the --cgroups-per-qos flag. This flag is enabled by default. When enabled, the kubelet will parent all end-user pods under a cgroup hierarchy managed by the kubelet. Following is the recommended cgroup configuration for Kubernetes nodes. All OS system daemons are expected to be placed under a top level SystemReserved cgroup. Kubelet and Container Runtime are expected to be placed under KubeReserved cgroup. kube-reserved is meant to capture resource reservation for kubernetes system daemons like the kubelet, container runtime, node problem detector, etc. system-reserved is meant to capture resource reservation for OS system daemons like sshd, udev, etc To optionally enforce system-reservedon system daemons, specify the parent control group for OS system daemons as the value for --system-reserved-cgroup kubelet flag. If this specification includes an invalid cgroup, then Kubelet will fail to enforce system-reserved, and will trigger the FailedNodeAllocatableEnforcement event. |
|
Sandbox changed |
Indicates the number of times the SandboxChanged event occurred in the last measurement period. |
Number |
Whenever the config map or any other part of a Pod setup changes, the SandboxChanged event is triggered. |
|
Failed to create pod sandbox |
Indicates the number of times the FailedCreatePodSandBox event occurred in the last measurement period. |
Number |
At the lowest layers of a Kubernetes node is the software that, among other things, starts and stops containers. We call this the “Container Runtime”. The plugin API for container runtimes in Kubernetes is called Container Runtime Interface (CRI). A Pod is composed of a group of application containers in an isolated environment with resource constraints. In CRI, this environment is called PodSandbox. Before starting a Pod, kubelet calls RuntimeService.RunPodSandbox to create the environment. This includes setting up networking for a pod (e.g., allocating an IP). If kubelet is unable to create the environment for running a Pod, the FailedCreatePodSandBox event is triggered. Use the detailed diagnosis of this measure to know when this event occurred, why, on which nodes, and which Pods were impacted. |
|
Failed pod sandbox status |
Indicates the number of times the FailedPodSandBoxStatus event occurred in the last measurement period. |
Number |
If kubelet is unable to get the Pod sandbox status, then the FailedPodSandBoxStatus event is triggered. Use the detailed diagnosis of this measure to know when this event occurred, why, on which nodes, and which Pods were impacted. |
|
Container probe warnings |
Indicates the number of times the ContainerProbeWarning event occurred in the last measurement period. |
Number |
A Probe is a diagnostic performed periodically by the kubelet on a Container. The kubelet can optionally perform and react to three kinds of probes on running Containers:
A ContainerProbeWarning event is triggered when any of these probes fail. Use the detailed diagnosis of this measure to know when this event occurred, why, on which nodes, and which Pods were impacted. |
|
Failed post start hook |
Indicates the number of times the FailedPostStartHook event occurred during the last measurement period. |
Number |
Hooks enable Containers to be aware of events in their management lifecycle and run code implemented in a handler when the corresponding lifecycle hook is executed. There are two hooks that are exposed to Containers:
If a hook handler fails, it broadcasts an event. While failure of the PostStart hook handler triggers the FailedPostStartHook event, the failure of the PreStop hook handler triggers the FailedPreStopHook event. Use the detailed diagnosis of these measures to know when these events occurred, why, on which nodes, and which Pods were impacted. |
|
Failed pre stop hook |
Indicates the number of times the FailedPreStopHook event occurred during the last measurement period. |
Number |
|
|
Node has sufficient memory |
Indicates the number of times the NodeHasSufficientMemory event occurred in the last measurement period. |
Number |
If the MemoryPressure condition of a node is False, it implies that that node has sufficient memory. In such cases, the NodeHasSufficientMemory event is generated. Use the detailed diagnosis of this measure to know when this event occurred, on which nodes, and which Pods were impacted. |
|
Failed resource metric |
Indicates the number of times the FailedGetResourceMetric event occurred in the last measurement period. |
Number |
The Horizontal Pod Autoscaler automatically scales the number of Pods in a replication controller, deployment or replica set based on observed CPU utilization (or, with custom metrics support, on some other application-provided metrics). At configured intervals, the controller manager queries the resource utilization against the metrics specified in each HorizontalPodAutoscaler definition. The controller manager obtains the metrics from either the resource metrics API (for per-pod resource metrics), or the custom metrics API (for all other metrics). Typically, metrics are fetched from a series of aggregated APIs - metrics.k8s.io, custom.metrics.k8s.io, and external.metrics.k8s.io. The controller then calculates the actual utilization value of the resource, considers the target/desired utilization value that is set, and computes the ratio between the desired and actual metric value. The autoscaler then scales the desired number of replicas up or down based on this ratio. One of the common reasons for the failure of auto-scaling is the inability of the controller to fetch the resource metrics from the API. Without the metrics, scales cannot be computed, and consequently, the count of replicas cannot be scaled up/down. The FailedGetResourceMetric is broadcast everytime the controller fails to get resource metrics. Use the detailed diagnosis of this measure to know when this event occurred, why, on which nodes, and which Pods were impacted. |
|
Node has no disk pressure |
Indicates the number of times the NodeHasNoDiskPressure event occurred in the last measurement period. |
Number |
If the DiskPressure condition of a node is False, it implies that that node has sufficient disk space. In such cases, the NodeHasNoDiskPressure event is generated. Use the detailed diagnosis of this measure to know when this event occurred, on which nodes, and which Pods were impacted. |
|
Node has sufficient PID |
Indicates the number of times the NodeHasSufficientPID event occurred in the last measurement period. |
Number |
If the PIDPressure condition of a node is False, it implies that that node has sufficient processes. In such cases, the NodeHasSufficientPID event is generated. Use the detailed diagnosis of this measure to know when this event occurred, on which nodes, and which Pods were impacted. |
|
Provisioning failed |
Indicates the number of times the ProvisioningFailed event occurred in the last measurement period. |
Number |
This event is triggered if Kubernetes fails to provision a volume for a PVC. If a PV belonging to a StorageClass needs to be dynamically provisioned for a PVC, then a key field that your StorageClass definition should contain is the Provisioner. A Provisioner determines what volume plugin is to be used for provisioning PVs dynamically. Likewise, the definition should also include mountOptions. In this case, if the Provisioner - i.e., volume plugin - in use does not support mount options, then volume provisioning will fail. Where multiple mountOptions are provided, provisioning failures will also occur if even one of the mount options is found to be invalid. Provisioning failures may also occur if:
Use the detailed diagnosis of this measure to know when this event occurred, why, on which nodes, and which Pods were impacted. |
|
Back-off restarting failed containers |
Indicates the number of times the BackOff event occurred in the last measurement period. |
Number |
If this event is triggered, it means that Kubernetes started your container, then the container subsequently exited. This forced Kubernetes to restart the container. After restarting it a few times, Kubernetes declares that the container is in the BackOff state. However, Kubernetes will keep on trying to restart it. Common causes for this are:
Use the detailed diagnosis of this measure to know when this event occurred, why, on which nodes, and which Pods were impacted. |
|
Completed jobs |
Indicates the number of times the SawCompletedJob event occurred in the last measurement period. |
Number |
A Job creates one or more Pods and ensures that a specified number of them successfully terminate. As pods successfully complete, the Job tracks the successful completions. When a specified number of successful completions is reached, the task (ie, Job) is complete. This event is triggered every time a Job completes. |
|
Error creating pods |
Indicates the number of times the FailedCreate event occurred, with the message "Error creating: pods", in the last measurement period |
Number |
If a Job fails to create Pods, then this event is triggered. An entire Pod can fail for a number of reasons, such as when the Pod is kicked off the node (node is upgraded, rebooted, deleted, etc.), or if a container of the Pod fails and the .spec.template.spec.restartPolicy = "Never". When a Pod fails, then the Job controller starts a new Pod. Use the detailed diagnosis of this measure to know when this event occurred, why, on which nodes, and which Pods were impacted. |
|
Successfully schedule pods |
Indicates the number of times the Scheduled event occurred, in the last measurement period. |
Number |
This event is generated if a Pod is successfully scheduled to a node. |
|
Failed to schedule pods |
Indicates the number of times the FailedScheduling event occurred in the last measurement period. |
Number |
This event is generated if a Pod could not be scheduled to any node in a cluster. One of the common causes for scheduling failures is the lack of adequate memory and/or CPU resources in the nodes to accommodate the Pods. Use the detailed diagnosis of this measure to know when this event occurred, why, on which nodes, and which Pods were impacted. |
|
Failed to stop pods |
Indicates the number of times the FailedKillPod event occurred in the last measurement period. |
Number |
This event occurs if a Pod is stuck in the Terminating state. This is detected by finding Pods where every container has been terminated, but the Pod is still running. Usually, this is caused when a node in the cluster gets taken out of service abruptly, and the cluster scheduler and controller-manager do not clean up all of the pods on that node. Use the detailed diagnosis of this measure to know when this event occurred, why, on which nodes, and which Pods were impacted. |
|
Failed to create pods |
Indicates the number of times the FailedCreatePodContainer event occurred in the last measurement period. |
Number |
This event is generated if Kubernetes fails to create a container in a Pod. Use the detailed diagnosis of this measure to know when this event occurred, why, on which nodes, and which Pods were impacted. |
|
Network is not ready |
Indicates the number of times the NetworkNotReady event occurred in the last measurement period. |
Number |
This event is triggered if the Pod's runtime network is not ready. |
|
Failed to place pods on node |
Indicates the number of times the FailedPlacement event occurred in the last measurement period. |
Number |
This event is triggered if the Daemonset Controller fails to place a Pod on a node. Common reasons for this are:
Use the detailed diagnosis of this measure to know when this event occurred, why, on which nodes. |
|
Found failed daemon pods on node |
Indicates the number of times the FailedDaemonPod event occurred in the last measurement period. |
Number |
This event is often associated with the cluster health rather than issues with the daemon set. Use the detailed diagnosis of this measure to know when this event occurred, why, on which nodes. |
|
Failed to cancel deployments |
Indicates the number of times the DeploymentCancellationFailed event occurred in the last measurement period. |
Number |
While a running Deployment can be canceled, most often, it is the stuck Deployments that are canceled. The cancellation is a best-effort operation, and may take some time to complete. The replication controller may partially or totally complete its deployment before the cancellation is effective. If a Deployment is successfully canceled, then the DeploymentCancelled event is triggered. When canceled, the deployment configuration will be automatically rolled back by scaling up the previous running replication controller. On the other hand, if cancellation of a Deployment fails, then the DeploymentCancellationFailed event is triggered. You can use the detailed diagnosis of these measures to know when each of these events occurred, why, and on which nodes. |
|
Cancelled deployments |
Indicates the number of times the DeploymentCancelled event occurred in the last measurement period. |
Number |
|
|
Created new replication controllers |
Indicates the number of times the DeploymentCreated event occurred in the last measurement period. |
Number |
This event is triggered every time a new Deployment is created. You can use the detailed diagnosis of this measure to know when this event occurred, on which nodes, and which Pods were created in the process. |
|
No available ingress IP to allocate to service |
Indicates the number of times the IngressIPRangeFull event occurred in the last measurement period. |
Number |
Ingress exposes HTTP and HTTPS routes from outside the cluster to services within the cluster. Traffic routing is controlled by rules defined on the Ingress resource. An Ingress can be configured to give Services externally-reachable URLs, load balance traffic, terminate SSL / TLS, and offer name based virtual hosting. An Ingress controller is responsible for fulfilling the Ingress, usually with a load balancer, though it may also configure your edge router or additional frontends to help handle the traffic. When an Ingress is created, typically, an IP address is allocated by the Ingress Controller to satisfy the Ingress. Ingress controllers and load balancers may take a minute or two to allocate an IP address. Until that time, you often see the address listed as <pending>. Sometimes, the Ingress Controller may not find any IP address to allocate to the service for which the Ingress was created. In this case, the Ingress will fail with the event IngressIPRangeFull. Use the detailed diagnosis of this measure to know when this event occurred, why, and which nodes and Pods were impacted by the event. |
|
Failed to detach volumes |
Indicates the number of times the FailedDetachVolume event occurred in the last measurement period. |
Number |
This event is triggered if a volume fails to be detached from a node. A Persistent Volume that cannot be detached poses a problem if you try to create another Pod using the same PVC. Use the detailed diagnosis of this measure to know when this event occurred, why, and which nodes and Pods were impacted by the event. |
|
Failed to unmount volumes |
Indicates the number of times the FailedUnMount event occurred in the last measurement period. |
Number |
This event is triggered if Kubernetes failed to unmount a volume from a node. Use the detailed diagnosis of this measure to know when this event occurred, why, and which nodes and Pods were impacted by the event. |
|
Failed unmapped devices |
Indicates the number of times the FailedUnmapDevice event occurred in the last measurement period. |
Number |
If a Pod mounted with a storage device - i.e., a volume - is deleted, then the tear down process should be able to unmap the device. If it fails to do so, then the FailedUnmapDevice event is triggered. Use the detailed diagnosis of this measure to know when this event occurred, why, and which nodes and Pods were impacted by the event. |
|
Unsupported mount option |
Indicates the number of times the UnsupportedMountOptionevent occurred in the last measurement period. |
Number |
If a PV belonging to a StorageClass needs to be dynamically provisioned for a PVC, then a key field that your StorageClass definition should contain is the Provisioner. A Provisioner determines what volume plugin is to be used for provisioning PVs dynamically. Additionally, the definition may also include mountOptions. In this case, if the Provisioner - i.e., volume plugin - in use does not support mount options, then the UnsupportedMountOption event will be triggered, resulting in the failure of volume provisioning. Where multiple mountOptions are provided, provisioning failures will also occur if even one of the mount options is found to be invalid. Use the detailed diagnosis of this measure to know when this event occurred, why, and which nodes and Pods were impacted by the event. |
|
Invalid selector |
Indicates the number of times the InvalidSelector event occurred in the last measurement period. |
Number |
If this event occurs, it implies that the target scalable's selector could not be parsed. Use the detailed diagnosis of this measure to know when this event occurred, why, and which nodes and Pods were impacted by the event. |
|
Unknown metric source type |
Indicates the number of times the InvalidMetricSourceType event occurred in the last measurement period. |
Number |
This event occurs if the HPA controller encounters an unknown metric source type. Use the detailed diagnosis of this measure to know when this event occurred, why, and which nodes and Pods were impacted by the event. |
|
Failed to convert the given HPA |
Indicates the number of times the FailedConvertHPA event occurred in the last measurement period. |
Number |
This event is fired if the the HPA controller was unable to convert the given HPA to the v2alpha1 version. Use the detailed diagnosis of this measure to know when this event occurred, why, and which nodes and Pods were impacted by the event. |
|
HPA controller was unable to get the targets |
Indicates the number of times the FailedGetScale event occurred in the last measurement period. |
Number |
This event is triggered if the Horizontal Pod Autoscaler (HPA) was not able to get the scale for the given scalable resource. If this event occurs, then the HPA will be unable to perform up/down scaling. Therefore, the AbleToScale status condition of the HPA will become False. Use the detailed diagnosis of this measure to know when this event occurred, why, and which nodes and Pods were impacted by the event. |
|
Failed to compute desired number of replicas |
Indicates the number of times the FailedComputeMetricsReplicas event occurred in the last measurement period. |
Number |
This event is triggered if the Horizontal Pod Autoscaler is unable to compute the replica count. This can happen if the controller is unable to connect to the custom/resource metrics API, for any reason. Because of this, the controller will not be able to compute the resource utilization value. Without the resource utilization, the controller will not be able to compute the replica count. Use the detailed diagnosis of this measure to know when this event occurred, why, and which nodes and Pods were impacted by the event. |
|
Failed rescale |
Indicates the number of times the FailedRescale event occurred in the last measurement period. |
Number |
A scale update was needed and the HPA controller was unable to actually update the scale subresource of the target scalable, then this event is fired. Use the detailed diagnosis of this measure to know when this event occurred, why, and which nodes and Pods were impacted by the event. |
|
Failed to update status |
Indicates the number of times the FailedUpdateStatus event occurred in the last measurement period. |
Number |
The event is triggered if the HPA controller fails to update the status of the HPA object. Use the detailed diagnosis of this measure to know when this event occurred, why, and which nodes and Pods were impacted by the event. |
|
No persistent volumes available |
Indicates the number of times the FailedBinding event occurred in the last measurement period. |
Number |
To associate a Pod with storage, a cluster administrator should first create a PersistentVolume (PV) that is backed by physical storage. A cluster user should then create a PersistentVolumeClaim (PVC), which gets automatically bound to a PV. Finally, the user creates a Pod that uses the PVC as storage. If a PVC is created, but no PersistentVolumes are available for the PVC to be bound to, then the FailedBinding event gets fired. In such cases, Pods that use unbound PVCs will stay in the Pending state, until the problem is resolved. Use the detailed diagnosis of this measure to know when this event occurred, why, and which nodes and Pods were impacted by the event. |
|
Volume size or class is different |
Indicates the number of times the VolumeMismatch event occurred in the last measurement period. |
Number |
This event is triggered if the volume size or class is different from what is requested in the claim. Typically, a user creates a PersistentVolumeClaim (PVC) with a specific amount of storage requested and with certain access modes. A control loop in the master watches for new PVCs, checks if any static PV (a PV manually created by the administrator) exactly matches the new PVC, and binds them together. Claims will remain unbound indefinitely if a matching volume does not exist. Claims will be bound as matching volumes become available. For example, a cluster provisioned with many 50Gi PVs would not match a PVC requesting 100Gi. The PVC can be bound when a 100Gi PV is added to the cluster. Until a 100Gi PV becomes available, the cluster will not bind the PVC with any of the existing PVs; instead, it will fail binding with the event VolumeMismatch. Use the detailed diagnosis of this measure to know when this event occurred, why, and which nodes and Pods were impacted by the event. |
|
Error creating recycler pods |
Indicates the number of times the VolumeFailedRecycle event occurred in the last measurement period. |
Number |
An administrator can configure a custom recycler Pod template using the Kubernetes controller manager command line arguments. The custom recycler Pod template must contain a volumes specification. You need to configure the path of the volume to be recycled in the path specification of the volumes section. Typically, when a Pod is deleted and the PV has to be freed up, the recycler Pod comes in and tries to make the PV available. But, sometimes, due to certain errors, the recycler POD may switch to the 'failed' state. For instance, if the recycler Pod fails to remove the .snapshot folder, the Pod will fail to be created. As a result, the PV too fails to become available - i.e., volume recycling fails. n such a situation, the VolumeFailedRecycle event is fired. Use the detailed diagnosis of this measure to know when this event occurred, why, and which nodes and Pods were impacted by the event. |
|
Volume is recycled |
Indicates the number of times the VolumeRecycled event occurred in the last measurement period. |
Number |
This event is triggered every time a volume is successfully recycled. Use the detailed diagnosis of this measure to know when this event occurred, why, and which nodes and Pods were impacted by the event. |
|
Pod is recylced |
Indicates the number of times the RecyclerPod event occurred in the last measurement period. |
Number |
This event is triggered every time a recycler pod is successfully recycled. Use the detailed diagnosis of this measure to know when this event occurred, why, and which nodes and Pods were impacted by the event. |
|
Volume is deleted |
Indicates the number of times the VolumeDelete event occurred in the last measurement period. |
Number |
Every time a volume is deleted, the VolumeDelete event is triggered. Use the detailed diagnosis of this measure to know when this event occurred, why, and which nodes and Pods were impacted by the event. |
|
Error when deleting the volume |
Indicates the number of times the VolumeFailedDelete event occurred in the last measurement period. |
Number |
This event is triggered if volume deletion fails. This can happen if the path specification in your PV does not match with the actual path of the volume being deleted. Use the detailed diagnosis of this measure to know when this event occurred, why, and which nodes and Pods were impacted by the event. |
|
Error cleaning provisioned volume |
Indicates the number of times the ProvisioningCleanupFailed event occurred in the last measurement period. |
Number |
This event is triggered if a provisioned volume is not automatically cleaned up, when the Pod mounting that volume is removed. In this case, you will have to manually delete the volume. Use the detailed diagnosis of this measure to know when this event occurred, why, and which nodes and Pods were impacted by the event. |
|
Error creating load balancer |
Indicates the number of times the CreatingLoadBalancerFailed event occurred in the last measurement period. |
Number |
If the static IP address defined in the loadBalancerIP property of the Kubernetes service manifest does not exist, or has not been created in the node resource group and no additional delegations are configured, the load balancer service creation fails with the event CreatingLoadBalancerFailed. Many load balancer issues around creating, updating, and deleting the load balancer can also be traced to a permissions issue with your cloud provider. Ensure that your Kubernetes nodes have the ability to create and modify load balancers in your cloud provider to avoid these issues. If your cloud provider provides Identity & Access Management (IAM) double-check the permissions that your nodes and pods have. Use the detailed diagnosis of this measure to know when this event occurred, why, and which nodes and Pods were impacted by the event. |
|
Deleting load balancer |
Indicates the number of times the DeletingLoadBalancer event occurred in the last measurement period. |
Number |
Use the detailed diagnosis of this measure to know when this event occurred, why, and which nodes and Pods were impacted by the event. |
|
Not available nodes for Load Balancer service |
Indicates the number of times the UnAvailableLoadBalancer event occurred in the last measurement period. |
Number |
Load balancers require at least one server to send traffic to for the load balancing. This can be an issue if the service is not able to target any pods, or if the load balancer is unable to health check any servers in your cluster. In such a situation, the UnAvailableLoadBalancer event gets fired. To troubleshoot this issue, check the endpoints registered with the service using kubectl describe service <service>, figure out which nodes those pods run on, and compare it to the servers registered to the load balancer in your cloud provider. Use the detailed diagnosis of this measure to know when this event occurred, why, and which nodes and Pods were impacted by the event. |
|
Error updating load balancer with new hosts |
Indicates the number of times the LoadBalancerUpdateFailed event occurred in the last measurement period. |
Number |
Many load balancer issues around creating, updating, and deleting the load balancer can be traced to a permissions issue with your cloud provider. Ensure that your Kubernetes nodes have the ability to create and modify load balancers in your cloud provider to avoid these issues. If your cloud provider provides Identity & Access Management (IAM) double-check the permissions that your nodes and pods have. Use the detailed diagnosis of this measure to know when this event occurred, why, and which nodes and Pods were impacted by the event. |
|
Error deleting load balancer |
Indicates the number of times the DeletingLoadBalancerFailed event occurred in the last measurement period. |
Number |
Many load balancer issues around creating, updating, and deleting the load balancer can be traced to a permissions issue with your cloud provider. Ensure that your Kubernetes nodes have the ability to create and modify load balancers in your cloud provider to avoid these issues. If your cloud provider provides Identity & Access Management (IAM) double-check the permissions that your nodes and pods have. Use the detailed diagnosis of this measure to know when this event occurred, why, and which nodes and Pods were impacted by the event. |
|
Deleted load balancer |
Indicates the number of times the DeletedLoadBalancer event occurred in the last measurement period. |
Number |
This event occurs if a load balancer is deleted. Use the detailed diagnosis of this measure to know when this event occurred, why, and which nodes and Pods were impacted by the event. |
|
System out of memory |
Indicates the number of times the SystemOOM event occurred in the last measurement period. |
Number |
This event is triggered if a node runs out of memory. Such an event can happen if the kubelet is unable to reclaim memory by proactively failing one or more Pods on the node. Use the detailed diagnosis of this measure to know when this event occurred, why, and which nodes and Pods were impacted by the event. |
|
Evicted pods |
Indicates the number of times the Evicted event occurred in the last measurement period. |
Number |
This event happens when a node determines that Pods need to be evicted, or terminated, to free up some resource such as CPU, memory, or disk. This can have devastating consequences if the kubelet is unable to determine the best resources to evict. For instance, if a kubelet detecting disk pressure on a node evicted Pods that have no effect on disk usage, then such an eviction will not ease the disk space crunch on that node. Moreover, since the evicted Pods would get scheduled on other nodes, they will also overload the other nodes, thus causing more evictions. Knowing when evictions happened, and being able to correlate it with other events in that time frame, can help avoid the issue. Use the detailed diagnosis of this measure to know when this event occurred, why, and which nodes and Pods were impacted by the event. |
|
Nodes are not schedulable |
Indicates the number of times the NodeNotSchedulable event occurred during the last measurement period. |
Number |
Node events like NodeNotReady or NodeNotSchedulable will inform you that a cluster node isn’t yet ready to schedule any workloads. Use the detailed diagnosis of this measure to know when this event started, when it ended, and which nodes were found not schedulable in the process, and which Pods were scheduled to those nodes. |
|
Failed to inspect images |
Indicates the number of times the InspectFailed event occurred during the last measurement period. |
Number |
Use the detailed diagnosis of this measure to know when this event occurred, why, and which nodes and Pods were impacted by the event. |
|
Containers started |
Indicates the number of times the StartedContainer event occurred during the last measurement period. |
Number |
|
|
Pods failed to delete |
Indicates the number of times the FailedCreate event occurred during the last measurement period. |
Number |
Use the detailed diagnosis of this measure to know when this event occurred, why, on which nodes, and which Pods were impacted. |
|
Node allocatable enforced |
Indicates the number of times the NodeAllocatableEnforced event occurred during the last measurement period. |
Number |
|
You can use the detailed diagnosis of the Back-off restarting failed containers measure to know when the BackOff event occurred, the message that was displayed when the event occurred, and the nodes and Pods impacted by the event.

Figure 1 : The detailed diagnosis of the Back-off restarting failed containers measure
You can use the detailed diagnosis of the Killing containers measure to know when the Killing event occurred, the message that was displayed when the event occurred, and the nodes and Pods impacted by the event.
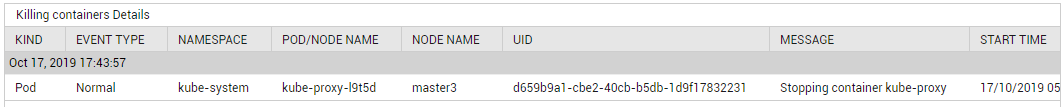
Figure 2 : The detailed diagnosis of the Killing containers measure
Using the detailed diagnosis of the Containers exceeded grace period measure, you can quickly determine when the ExceededGracePeriod event occurred, why the event was triggered, and which nodes and Pods were impacted by the event.

Figure 3 : The detailed diagnosis of the Containers exceeded grace period measure
Using the detailed diagnosis of the Evicted pods measure, you can quickly determine when the Evicted event occurred, why the event was triggered, and which nodes and Pods were impacted by the event.

Figure 4 : The detailed diagnosis of the Evicted pods measure
With the help of the detailed diagnosis of the Failed to stop pods measure, you can at-a-glance figure out when the FailedKillPod event occurred, and which nodes and Pods were impacted by that event. You can also view the error message that Kubernetes throws when firing this event, so you can troubleshoot easily.

Figure 5 : The detailed diagnosis of the Failed to stop pods measure
Use the detailed diagnosis of the Pulling images measures to know when the Pulling event occurred, which image was being pulled, and which nodes and Pods were impacted by the event.

Figure 6 : The detailed diagnosis of the Pulling images measure
Use the detailed diagnosis of the Failed resource measure to determine when the FailedGetResourceMetric event occurred, what could have caused the event to be triggered, and which Pods were impacted by the event.

Figure 7 : The detailed diagnosis of the Failed resource metric measure
Using the detailed diagnosis of the Failed to compute desired number of replicas measure to know when the FailedComputeMetricsReplicas event occurred, why, and which Pods were impacted.

Figure 8 : The detailed diagnosis of the Failed to compute desired number of replicas measure
By viewing the detailed diagnosis of the Found failed daemon pods on node measure, you will be able to ascertain when the FailedDaemonPod event occurred and which Pod was impacted by the event. The detailed diagnosis also reveals the error message that the event throws, so you can troubleshoot easily.

Figure 9 : The detailed diagnosis of the Found failed daemon pods on node measure