K8s Pods by Namespace Test
Pods are the smallest deployable units of computing that can be created and managed in Kubernetes. A Pod (as in a pod of whales or pea pod) is a group of one or more containers (such as Docker containers), with shared storage/network, and a specification for how to run the containers. A Pod’s contents are always co-located and co-scheduled, and run in a shared context.
Pods are created, assigned a unique ID (UID), and scheduled to nodes where they remain until termination (according to restart policy) or deletion. If a Node dies, the Pods scheduled to that node are scheduled for deletion, after a timeout period. At any given point in time, an administrator needs to know at which phase a Pod is in its life cycle, so they can promptly detect Pod failures or undue slowness in Pod creation and rapidly initiate investigations into the same. This is necessary because, if a Pod fails, then the cluster's actual state may go out of sync with its desired state.
Once a Pod is assigned to a node by scheduler, kubelet starts creating containers using container runtime. Alongside status of Pods, an administrator also needs to keep track of the status of containers at all times, as container failures impact the availability and performance of the containerized applications. This way, administrators can detect and resolve issues in containerized applications before end-users notice.
Typically, when Pods run containers, they use the CPU and memory resources on the node to which they are scheduled. By default, a Pod in Kubernetes will run with no limits on CPU and memory. This means that a single Pod can end up hogging the resources of the node! To avoid this, administrators can control the amount of CPU and memory resources each container in a Pod can use by setting resource requests and limits in the Pod configuration file. A Pod can use as much compute resources as represented by the sum of requests and limits of all containers in that Pod. This means that if the per container limits are not prudently set, then you could have Pods that over-subscribe to the node's capacity. Also, if containers are not sized according to their actual usage, then it can adversely impact the performance of the containerized applications. This is why, it is imperative that administrators track the actual resource usage of Pods, proactively detect potential resource contentions, and tweak usage limits and/or priorities to prevent such contentions. The Pods by Namespace test helps administrators perform all of the above!
This test auto-discovers the Pods in each Namespace, and reports the status of each Pod and that of the containers in every Pod. This leads administrators to Pods and containers in an abnormal state. Additionally, the test reports the resource requests and limits for each Pod, the resource capacity of the Node to which each Pod is scheduled, and actual resource utilization. In the process, the test accurately pinpoints those Pods that are over-subscribing to the node's capacity and those Pods that may potentially cause a contention for resources on the node. Since the test also reveals the QoS priority setting of each Pod, administrators can also figure out if a change in priority can help prevent probable resource contentions/overcommitment.
Note:
This test collects metrics from an endpoint provided by a Metrics Server. This means, for this test to run, a Metrics Server needs to be installed in the cluster. Metrics Server is a cluster-wide aggregator of resource usage data. By default, it is deployed in clusters created by kube-up.sh script as a Deployment object. If you use a different Kubernetes setup mechanism, you can deploy it using the provided deployment components.yaml file. To know how to use the yaml file to install the Metrics Server, follow the steps detailed in the
Target of the test : A Kubernetes/OpenShift Cluster
Agent deploying the test : A remote agent
Outputs of the test : One set of results for each Pod in every namespace in the Kubernetes/OpenShift cluster being monitored
| Parameter | Description |
|---|---|
|
Test Period |
How often should the test be executed. |
|
Host |
The IP address of the host for which this test is to be configured. |
|
Port |
Specify the port at which the specified Host listens. By default, this is 6443. |
|
Load Balancer / Master Node IP |
To run this test and report metrics, the eG agent needs to connect to the Kubernetes API on the master node and run API commands. To enable this connection, the eG agent has to be configured with either of the following:
By default, this parameter will display the Load Balancer / Master Node IP that you configured when manually adding the Kubernetes/OpenShift cluster for monitoring, using the Kubernetes Cluster Preferences page in the eG admin interface (see Figure 3). The steps for managing the cluster using the eG admin interface are discussed elaborately in How to Monitor the Kubernetes/OpenShift Cluster Using eG Enterprise? Whenever the eG agent runs this test, it uses the IP address that is displayed (by default) against this parameter to connect to the Kubernetes API. If there is any change in this IP address at a later point in time, then make sure that you update this parameter with it, by overriding its default setting. |
|
K8s Cluster API Prefix |
|
|
SSL |
By default, the Kubernetes/OpenShift cluster is SSL-enabled. This is why, the eG agent, by default, connects to the Kubernetes API via an HTTPS connection. Accordingly, this flag is set to Yes by default. If the cluster is not SSL-enabled in your environment, then set this flag to No. |
|
Authentication Token |
The eG agent requires an authentication bearer token to access the Kubernetes API, run API commands on the cluster, and pull metrics of interest. The steps for generating this token have been detailed in How Does eG Enterprise Monitor a Kubernetes/OpenShift Cluster?
Typically, once you generate the token, you can associate that token with the target Kubernetes cluster, when manually adding that cluster for monitoring using the eG admin interface. The steps for managing the cluster using the eG admin interface are discussed elaborately in How to Monitor the Kubernetes/OpenShift Cluster Using eG Enterprise? By default, this parameter will display the Authentication Token that you provided in the Kubernetes Cluster Preferences page of the eG admin interface, when manually adding the cluster for monitoring (see Figure 3). Whenever the eG agent runs this test, it uses the token that is displayed (by default) against this parameter only accessing the API and pulling metrics. If for any reason, you generate a new authentication token for the target cluster at a later point in time, then make sure you update this parameter with the change. For that, copy the new token and paste it against this parameter. |
|
Report System Namespace |
The kube-system namespace consists of all objects created by the Kubernetes system. Monitoring such a namespace may not only increase the eG agent's processing overheads, but may also clutter the eG database. Therefore, to optimize agent performance and to conserve database space, this test, by default, excludes the kube-system namespace from monitoring. Accordingly, this flag is set to No by default. If required, you can set this flag to Yes, and enable monitoring of the kube-system namespace. |
|
Proxy Host |
If the eG agent connects to the Kubernetes API on the master node via a proxy server, then provide the IP address of the proxy server here. If no proxy is used, then the default setting -none - of this parameter, need not be changed, |
|
Proxy Port |
If the eG agent connects to the Kubernetes API on the master node via a proxy server, then provide the port number at which that proxy server listens here. If no proxy is used, then the default setting -none - of this parameter, need not be changed, |
|
Max Pods Limit |
In environments where thousands of Pods are auto-discovered during each measure cycle, the eG agent experienced overheads while collecting the measures for each Pod and reporting the same to the eG manager. To ensure that the metrics of all the Pods are seamlessly reported by this test, by default, this parameter is set to 2500 indicating that the Pods that can be discovered during each measure cycle is limited to 2500. |
|
Proxy Username, Proxy Password, Confirm Password |
These parameters are applicable only if the eG agent uses a proxy server to connect to the Kubernetes/OpenShift cluster, and that proxy server requires authentication. In this case, provide a valid user name and password against the Proxy Username and Proxy Password parameters, respectively. Then, confirm the password by retyping it in the Confirm Password text box. If no proxy server is used, or if the proxy server used does not require authentication, then the default setting - none - of these parameters, need not be changed. |
|
DD Frequency |
Refers to the frequency with which detailed diagnosis measures are to be generated for this test. The default is 1:1. This indicates that, by default, detailed measures will be generated every time this test runs, and also every time the test detects a problem. You can modify this frequency, if you so desire. Also, if you intend to disable the detailed diagnosis capability for this test, you can do so by specifying none against DD frequency. |
|
Detailed Diagnosis |
To make diagnosis more efficient and accurate, the eG Enterprise embeds an optional detailed diagnostic capability. With this capability, the eG agents can be configured to run detailed, more elaborate tests as and when specific problems are detected. To enable the detailed diagnosis capability of this test for a particular server, choose the On option. To disable the capability, click on the Off option. The option to selectively enable/disable the detailed diagnosis capability will be available only if the following conditions are fulfilled:
|
| Measurement | Description | Measurement Unit | Interpretation | ||||||||||||||||
|---|---|---|---|---|---|---|---|---|---|---|---|---|---|---|---|---|---|---|---|
|
Status |
Indicates where this Pod is in its lifecycle. |
|
A Pod can be in one of the following phases in its lifecycle:
The numeric values that correspond to this are detailed in the table below:
Note: By default, this test reports the Measure Values listed in the table above to indicate the state of a Pod. In the graph of this measure however, the state is indicated using the numeric equivalents only. If a Pod is in the Pending state for too long, it could be a sign that the Kubelet is having problems connecting to the container runtime running below. Use the detailed diagnosis of this measure to know which containers are in the Pod, the images used by the containers, and the reason for the status.
|
||||||||||||||||
|
Time since pod creation |
Indicates how old this Pod is. |
|
The value of this measure is expressed in number of days, hours, and minutes. Use the detailed diagnosis of this measure to know which node a Pod is scheduled to, the IP address of the Pod, and the images used by the containers in the Pod. |
||||||||||||||||
|
Termination grace period |
Shows the optional duration in seconds the Pod needs to terminate gracefully. |
Seconds |
Because Pods represent running processes on nodes in the cluster, it is important to allow those processes to gracefully terminate when they are no longer needed (vs being violently killed with a KILL signal and having no chance to clean up). Users should be able to request deletion and know when processes terminate, but also be able to ensure that deletes eventually complete. When a user requests deletion of a Pod, the system records the intended grace period before the Pod is allowed to be forcefully killed, and a TERM signal is sent to the main process in each container. Once the grace period has expired, the KILL signal is sent to those processes, and the Pod is then deleted from the API server. The default grace period is 30 seconds. The kubectl delete command supports the --grace-period=<seconds> option which allows a user to override the default and specify their own value. The value 0 force deletes the Pod. You must specify an additional flag --force along with --grace-period=0 in order to perform force deletions. |
||||||||||||||||
|
Quality of service |
Indicates the Quality of Service (QOS) classification assigned to this Pod based on resource requirement. |
|
Kubernetes provides different levels of Quality of Service to pods depending on what they request and what limits are set for them. Pods that need to stay up and consistently good can request guaranteed resources, while pods with less exacting requirements can use resources with less/no guarantee. For each resource, Kubernetes divide Pods into 3 QoS classes: Guaranteed, Burstable, and Best-Effort, in decreasing order of priority.
This test reports one of the above 3 QOS classes as the value of this measure. The numeric values that correspond to these measure values are as follows:
Note: By default, this test reports the Measure Values listed in the table above to indicate the QOS class of a Pod. In the graph of this measure however, the same is indicated using the numeric equivalents only. |
||||||||||||||||
|
Restart policy |
Indicates the restart policy of all containers within this Pod. |
|
This measure reports one of the following values:
The numeric values that correspond to these measure values are as follows:
Note: By default, this test reports the Measure Values listed in the table above to indicate the restart policy of the containers in a Pod. In the graph of this measure however, the same is indicated using the numeric equivalents only. |
||||||||||||||||
|
Are all init containers initialized? |
Indicates whether/not the init containers (if any) in this Pod have started successfully. |
|
Init containers are specialized containers that run before app containers in a Pod. Init containers can contain utilities or setup scripts not present in an app image. The values that this measure reports and their corresponding numeric values are detailed in the table below:
Note: By default, this test reports the Measure Values listed in the table above to indicate the status of Init containers. In the graph of this measure however, the same is indicated using the numeric equivalents only. If this measure reports the value No or Unknown for a Pod, then you can use the detailed diagnosis of this measure to figure out the reason for the same. |
||||||||||||||||
|
Is pod ready? |
Indicates whether/not this Pod is ready. |
|
If a Pod is in the Ready state, it means that the Pod is able to serve requests and should be added to the load balancing pools of all matching Services. The values that this measure reports and their corresponding numeric values are detailed in the table below:
Note: By default, this test reports the Measure Values listed in the table above to indicate the Ready state of a Pod. In the graph of this measure however, the same is indicated using the numeric equivalents only. |
||||||||||||||||
|
Are all containers ready? |
Indicates whether/not all containers in this Pod are ready. |
|
If a container is in the Ready state, it means that the container is ready to service requests. The values that this measure reports and their corresponding numeric values are detailed in the table below:
Note: By default, this test reports the Measure Values listed in the table above to indicate whether/not the containers in a Pod are ready. In the graph of this measure however, the same is indicated using the numeric equivalents only. |
||||||||||||||||
|
Is pod scheduled? |
Indicates whether/not this Pod has been scheduled to a node. |
|
The values that this measure reports and their corresponding numeric values are detailed in the table below:
Note: By default, this test reports the Measure Values listed in the table above to indicate whether/not a Pod has been scheduled to a node. In the graph of this measure however, the same is indicated using the numeric equivalents only. If this measure reports the value No for a Pod - i.e., if a Pod is not scheduled to a node - then you can use the detailed diagnosis of this measure to figure out the reason for the anomaly. |
||||||||||||||||
|
Total containers |
Indicates the count of containers in this Pod. |
Number |
|
||||||||||||||||
|
Volumes assigned |
Indicates the count of volumes mounted in this Pod. |
Number |
|
||||||||||||||||
|
Init containers |
Indicates the total number of init containers (if any) in this Pod. |
Number |
Init containers are specialized containers that run before app containers in a Pod. Init containers can contain utilities or setup scripts not present in an app image. |
||||||||||||||||
|
Priority |
Indicates the priority class assigned to this Pod. |
|
You can assign pods a priority class, which is a non-namespaced object that defines a mapping from a name to the integer value of the priority. The higher the value, the higher the priority. A priority class object can take any 32-bit integer value smaller than or equal to 1000000000 (one billion). Reserve numbers larger than one billion for critical pods that should not be preempted or evicted. There are two reserved priority classes for critical system pods to have guaranteed scheduling.
This test reports one of the above two priority classes as the value of this measure. The numeric values that correspond to these measure values are as follows:
Note: By default, this test reports the Measure Values listed in the table above to indicate the priority class assigned to a Pod. In the graph of this measure however, the same is indicated using the numeric equivalents only. |
||||||||||||||||
|
Running containers |
Indicates the count of running containers in this Pod. |
Number |
If a container is in the Running state, it indicates that the container is executing without any issues. Use the detailed diagnosis of this measure to know which containers in a Pod are in the Running state. There are multiple reasons why the number of running containers can change. That includes rescheduling containers in a different host because a node failed, or because there aren’t enough resources and the pod was evicted from a rolling deployment of a new version, and more. |
||||||||||||||||
|
Completed containers |
Indicates the count of containers in this Pod that are in a Terminated state. |
Number |
If a container is in the Terminated state, it means that the container completed its execution and has stopped running. A container enters into this when it has successfully completed execution or when it has failed for some reason. If the containers in a Pod entered this state because they have failed, then use the detailed diagnosis of this measure to know which are those containers, why the failure occurred, and the exit code. |
||||||||||||||||
|
Waiting containers |
Indicates the count of containers in this Pod that are in a Waiting state. |
Number |
Waiting state is the default state of a container. If container is not in either Running or Terminated state, it is in Waiting state. A container in Waiting state still runs its required operations, like pulling images, applying Secrets, etc. Use the detailed diagnosis of this measure to know which containers are in the Waiting state and why. |
||||||||||||||||
|
Uptime of the pods |
Indicates the total time for which the containers in this Pod were up and running. |
Seconds |
|
||||||||||||||||
|
Number of times container has been restarted |
Indicates the number of times the containers in this Pod have been restarted. |
Number |
Use the detailed diagnosis of this measure to identify the containers that were restarted and to determine the number of times each container was restarted. Frequently restarted containers can thus be isolated. When deploying a new version that is broken, if there are not enough resources available or some requirements/dependencies aren’t in place, you might end up with a container or pod continuously restarting in a loop. This is called CrashLoopBackOff. When this happens, pods never get into ready status and, therefore, counted as unavailable and not as running. By tracking the variations to this measure value over time, you can proactively detect a CrashLoopBackOff. |
||||||||||||||||
|
CPU requests |
Indicates the minimum CPU resources guaranteed to this Pod. |
Millicpu |
This is the sum of CPU requests configured for all containers in a Pod. A request is the amount of that resource that the system will guarantee to the Pod. |
||||||||||||||||
|
CPU limits |
Indicates that maximum amount of CPU resources that this Pod can use. |
Millicpu |
This is the sum of CPU limits set for all containers in a Pod. A limit is the maximum amount that the system will allow the Pod to use. |
||||||||||||||||
|
Total CPUs on node |
Indicates the total number of CPU cores available to the node to which this Pod is scheduled. |
Number |
|
||||||||||||||||
|
CPU capacity on node |
Indicates the CPU capacity of the node to which this Pod is scheduled. |
Millicpu |
|
||||||||||||||||
|
CPU limits allocation |
Indicates what percentage of the capacity of the node is allocated as CPU limits to containers in this Pod. In other words, this is the percentage of a node's CPU capacity that the containers on this Pod are allowed to use. |
Percent |
The formula used for computing this measure is as follows: (CPU limits/CPU capacity on node)*100 If the value of this measure exceeds 100%, it means that the Pod is oversubscribing to the node's capacity. In other words, it means that the Pod has been allowed to use more resources than the node's capacity. |
||||||||||||||||
|
CPU requests allocation |
Indicates what percentage of the total CPU capacity of the node is set as CPU requests for the containers on this Pod. In other words, this is the percentage of a node's CPU capacity that the containers on this Pod are guaranteed to receive. |
Percent |
The formula used for computing this measure is as follows: (CPU requests/CPU capacity on node)*100 Compare the value of this measure across Pods to know which Pod has been guaranteed the maximum CPU resources. |
||||||||||||||||
|
CPU usage |
Indicates the amount of CPU resources used by this Pod. |
Millicpu |
Ideally, the value of this measure should be much lesser than the value of the CPU capacity on node measure. If the value of this measure is equal to or is rapidly approaching the value of the CPU capacity on node measure, it means that the Pod is over-utilizing the CPU resources of the node. |
||||||||||||||||
|
CPU utilization |
Indicates the percentage of CPU resources utilized by this Pod. |
Percent |
A value close to 100% is indicative of excessive CPU usage by a Pod, and hints at a potential CPU contention on the node. A value greater than 100% implies that the Pod has probably over-subscribed to the node's capacity. |
||||||||||||||||
|
Containers without CPU limits set |
Indicates the number of containers in this Pod for which CPU limits are not set. |
Number |
If limit is not set, then if defaults to 0 (unbounded) |
||||||||||||||||
|
Containers without CPU requests set |
Indicates the number of containers in this Pod for which CPU requests are not set. |
Number |
In the case that request is not set for a container, it defaults to limit. |
||||||||||||||||
|
Memory requests |
Indicates the minimum memory resources guaranteed to this Pod. |
GB |
This is the sum of memory requests configured for all containers in a Pod. A request is the amount of that resource that the system will guarantee to the Pod. |
||||||||||||||||
|
Memory limits |
Indicates the maximum amount of memory resources that this Pod can use. |
GB |
This is the sum of memory limits set for all containers in a Pod. A limit is the maximum amount that the system will allow the Pod to use. |
||||||||||||||||
|
Memory capacity on node |
Indicates the memory capacity of the node to which this Pod is scheduled. |
GB |
|
||||||||||||||||
|
Memory limits allocation |
Indicates what percentage of the memory capacity of the node is allocated as memory limits to containers in this Pod. In other words, this is the percentage of a node's memory capacity that the containers on this Pod are allowed to use. |
Percent |
The formula used for computing this measure is as follows: (Memory limits/Memory capacity on node)*100 If the value of this measure exceeds 100%, it means that the Pod is oversubscribing to the node's capacity. In other words, it means that the Pod has been allowed to use more resources than the node's capacity. |
||||||||||||||||
|
Memory requests allocation |
Indicates what percentage of the total memory capacity of the node is set as memory requests for the containers on this Pod. In other words, this is the percentage of a node's memory capacity that the containers on this Pod are guaranteed to receive. |
Percent |
The formula used for computing this measure is as follows: (Memory requests/Memory capacity on node)*100 Compare the value of this measure across Pods to know which Pod has been guaranteed the maximum memory resources. |
||||||||||||||||
|
Memory usage |
Indicates the amount of memory resources used by this Pod. |
GB |
Ideally, the value of this measure should be much lesser than the value of the Memory capacity on node measure. If the value of this measure is equal to or is rapidly approaching the value of the Memory capacity on node measure, it means that the Pod is over-utilizing the memory resources of the node. |
||||||||||||||||
|
Memory utilization |
Indicates the percentage of memory resources utilized by this Pod. |
Percent |
A value close to 100% is indicative of excessive memory usage by a Pod, and hints at a potential memory contention on the node. A value greater than 100% implies that the Pod has probably over-subscribed to the node's capacity. |
||||||||||||||||
|
Containers without memory limits set |
Indicates the number of containers in this Pod for which memory limits are not set. |
Number |
If limit is not set, then it defaults to 0 (unbounded) |
||||||||||||||||
|
Containers without memory requests set |
Indicates the number of containers in this Pod for which memory requests are not set. |
Number |
In the case that request is not set for a container, it defaults to limit. |
||||||||||||||||
|
Termination failed containers |
Indicates the number of containers in this Pod that failed to terminate. |
Number |
If the containers in a Pod failed to terminate, then use the detailed diagnosis of this measure to know which are those containers, why the termination failed, and the exit code. |
||||||||||||||||
|
Network data received |
Indicates the rate at which data was received by this Pod over the network. |
KBps |
|
||||||||||||||||
|
Network data transmitted |
Indicates the rate at which data was transmitted from this Pod over the network. |
KBps |
|
||||||||||||||||
|
Recent container restarts |
Indicates the number of containers in this Pod that were restarted recently. |
Number |
Use the detailed diagnosis of this measure to know the Container name, Container id, Images name, Images id, Reason, and Last Start Time. |
||||||||||||||||
|
Disk usage |
Indicates the amount of disk space used by this pod.
|
MB |
|
||||||||||||||||
|
Data write rate to disk |
Indicates the amount of data written to the disk in this pod. |
KB/Sec |
|
||||||||||||||||
|
Disk write rate |
Indicates the number of times the data is written to the disk in this pod. |
Writes/Sec |
A dramatic increase in this value may be indicative of an I/O bottleneck.
|
||||||||||||||||
|
Disk read rate |
Indicates the number of times the data is read from the disk in this pod. |
Reads/Sec |
|||||||||||||||||
|
Data read rate from disk |
Indicates the amount of data read from the disk in this pod. |
KB/Sec |
|
The detailed diagnosis of the Status measure reveals which containers are in the Pod, the images used by the containers, and the reason for the status.
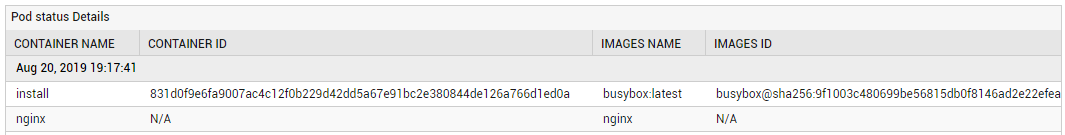
Figure 1 : The detailed diagnosis of the Status measure reported by the Pods by Namespace test
The detailed diagnosis of the Age measure reveals which node a Pod is scheduled to, the IP address of the Pod, and the images used by the containers in the Pod.
.png)
Figure 2 : The detailed diagnosis of the Age measure reported by the Pods by Namespace test
If the Are all init containers initialized? measure reports the value Yes or Unknown, then you can use the detailed diagnosis of this measure to figure out the reason why the init containers failed to initialize.
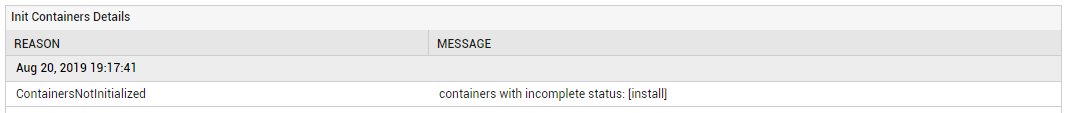
Figure 3 : The detailed diagnosis of the Are all init containers initialized? measure
If the containers in a Pod entered the Terminated state, then use the detailed diagnosis of the Terminated containers measure to know which are those containers, why the failure occurred, and the exit code.
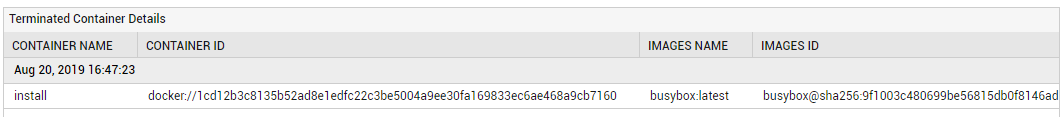
Figure 4 : The detailed diagnosis of the Terminated containers measure
Use the detailed diagnosis of the Waiting containers measure to know which containers are in the Waiting state and why.
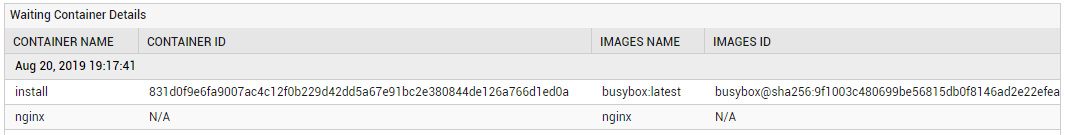
Figure 5 : The detailed diagnosis of the Waiting containers measure