Monitoring the Linux Systems Group
Log into the eG monitoring interface for viewing the current state of the managed Linux Systems Group component and the performance statistics it reports. In the eG monitoring console, eG Enterprise uses a specialized Linux Systems Group monitoring model to represent the real-time state of the Linux systems.
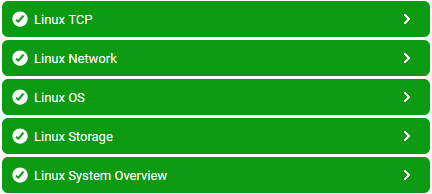
Figure 1 : Layer model of the Linux Systems Group component
The tests mapped to these layers report metrics that have been collected from those VM agents that have been configured to monitor the same Windows Systems Group component - i.e., that have been configured with the same Windows Systems Group component nick name. These tests track resource utilization, monitor disk activities, and report on the resource impact of those activities on the internal health of that system. Using the measures reported by these tests, administrators can find quick and accurate answers to the following performance queries:
-
Which users are logged on and when did each user login?
-
How much CPU, memory, GPU, and network resources is each system taking?
-
Which system is consuming high resources? has the peak usage times?
-
How long can the battery on a system (laptop) continue operating before it is completely discharged?
-
Did any system take too long to read/write data on the disk partition?
-
Which system is spending more CPU time handling hardware interrupts instead of executing normal processes?
-
Is any system handling the maximum internal and/or external traffic through a network interface?
-
Does any GPU allocated to a Linux system consume excessive power?
-
What is the current license status of each GPU on each system?