SQL Blocker Processes Test

One common problem encountered with databases is blocking. Suppose that process A is modifying data that process B wants to use. Process B will be blocked until process A has completed what it is doing. This is only one type of blocking situation; others exist and are common. What matters to a database administrator is identifying when blocking is a problem and how to deal with it effectively. When blocking is bad enough, users will notice slowdowns and complain about it. With a large number of users, it is common for tens or hundreds of processes to be blocked when slowdowns are noticed. Killing these processes may or may not solve the problem because 10 processes may be blocked by process B, while process B itself is blocked by process A. Issuing 10 kill statements for the processes blocked by B probably will not help, as new processes will simply become blocked by B. Killing process B may or may not help, because then the next process that was blocked by B, which is given execution time, may get blocked by process A and become the process that is blocking the other 9 remaining processes. When you have lots of blocking that is not resolving in a reasonable amount of time you need to identify the root blocker, or the process at the top of the tree of blocked processes. Imagine again that you have 10 processes blocked by process B, and process B is blocked by process A. If A is not blocked by anything, but is itself responsible for lots of blocking (B and the 10 processes waiting on B), then A would be the root blocker. (Think of it as a traffic jam. Figure 1 will help) Killing A (via kill) is likely to unblock B, and once B completes, the 10 processes waiting on B are also likely to complete successfully. The SQL Blocker Processes test monitors the number of root blocker processes in a database.

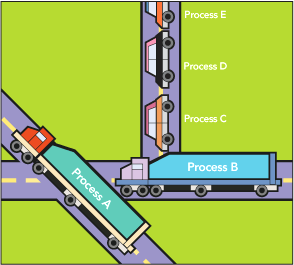
Figure 1 : The traffic jam analogy representing blocking

Target of the test : A Microsoft SQL server

Agent deploying the test : An internal agent

Outputs of the test : One set of results for every Microsoft SQL server monitored

Configurable parameters for the test
  1. TEST PERIOD - How often should the test be executed
  2. Host – The IP address of the Microsoft SQL server.
  3. Port - The port number through which the Microsoft SQL server communicates. The default port is 1433.
  4. ssl – If the Microsoft SQL server being monitored is an SSL-enabled server, then set the ssl flag to Yes. If not, then set the ssl flag to No.
  5. instance - In this text box, enter the name of a specific Microsoft SQL instance that is to be monitored. The default value of this parameter is “default”. To monitor a Microsoft SQL instance named “CFS”, enter this as the value of the INSTANCE parameter.
  6. USER – If a Microsoft SQL Server 7.0/2000 is monitored, then provide the name of a SQL user with the Sysadmin role in this text box. While monitoring a Microsoft SQL Server 2005 or above, provide the name of a SQL user with all of the privileges outlined in User Privileges Required for Monitoring Microsoft SQL server.

  7. password - The password of the specified user
  1. confirm password - Confirm the password by retyping it.
  1. domain - By default, none is displayed in the DOMAIN text box. If the ‘SQL server and Windows’ authentication has been enabled for the server being monitored, then the DOMAIN can continue to be none. On the other hand, if ‘Windows only’ authentication has been enabled, then, in the DOMAIN text box, specify the Windows domain in which the managed Microsoft SQL server exists. Also, in such a case, the USER name and PASSWORD that you provide should be that of a user authorized to access the monitored SQL server.
  2. isntlmv2 - In some Windows networks, NTLM (NT LAN Manager) may be enabled. NTLM is a suite of Microsoft security protocols that provides authentication, integrity, and confidentiality to users. NTLM version 2 (“NTLMv2”) was concocted to address the security issues present in NTLM. By default, the isntlmv2 flag is set to No, indicating that NTLMv2 is not enabled by default on the target Microsoft SQL host. Set this flag to Yes if NTLMv2 is enabled on the target host.
  3. ISPASSIVE – If the value chosen is yes, then the Microsoft SQL server under consideration is a passive server in a SQL cluster. No alerts will be generated if the server is not running. Measures will be reported as “Not applicable" by the agent if the server is not up.
  4. blocked session count – Specify the minimum number of sessions a process should block for this test to count that process as a root blocker. For instance, if you specify 10 here, it indicates that the Number of rootblockers measure of this test will include only those processes that are blocking 10 or more sessions.
  5. max blocking time secs – If a process is blocked for or beyond the duration (in seconds) specified here, then this test will count that process as a process that has been blocked for the maximum time. The details of such processes will then be captured and displayed as part of the detailed diagnosis of the Max waiting time measure. For example, if you specify 120 seconds here, then the detailed diagnosis of the Max waiting time measure will display the details of all processes that were blocked for 2 minutes and above.
  6. DETAILED DIAGNOSIS – To make diagnosis more efficient and accurate, the eG Enterprise embeds an optional detailed diagnostic capability. With this capability, the eG agents can be configured to run detailed, more elaborate tests as and when specific problems are detected. To enable the detailed diagnosis capability of this test for a particular server, choose the On option. To disable the capability, click on the Off option.

    The option to selectively enable/disable the detailed diagnosis capability will be available only if the following conditions are fulfilled:

    • The eG manager license should allow the detailed diagnosis capability
    • Both the normal and abnormal frequencies configured for the detailed diagnosis measures should not be 0.

Measurements made by the test
Measurement Description Measurement Unit Interpretation

Number of root blockers:

Indicates the number of root blocker processes.

Number

Usually, the number of root blocker processes should be low. If this value increases suddenly, this is a cause for concern. Likewise, if a root-blocker process has been blocking other processes for a long time, it is a reason for further investigation. The detailed diagnosis for this test, if enabled, provides details of the root blocker processes - their SPIDs, programs running these processes, and the queries being issued by these processes. It is usually the case that killing any root-blocker process that has been running for a long while will get the database running well again.

Blocked processes:

Indicates the number of processes that are blocked by the root blockers.

Number

Use the detailed diagnosis of this measure to know which processes are blocked.

Max waiting time:

Indicates the waiting time – i.e., blocked time – of that process(es) that was blocked for the maximum duration.

Secs

If the value of this measure matches or exceeds the max blocking time configuration of this test, it indicates that one/more processes have been blocked for a very long time. You can then use the detailed diagnosis of this measure to identify these blocked processes and figure out who initiated such processes and their resource usage. Processes that are resource hogs can thus be identified.